


Treasury Auctions: A Primer
Yields and Deals: Running Through Treasury Auctions

Hey all,
Another week of Treasury auctions, shifts in rate expectations and more— so pretty a standard week in macro.
Last night I was up finishing this primer, studying the week’s 2Y, 5Y & 7Y auctions before I had to hop on a call with a money manager over in New York.
Gotta love the game.
Anyway, auctions are a fundamental piece of global macro and have become somewhat of a hot topic given the large issuance from the Treasury. So here’s the primer I would have wanted when burning my eyes trying to get this knowledge into layman’s terms.
Enjoy.
Macro Snapshot
Cue the rate hike bets.
This is the 3y AGB (Australian Government Bond) post Wednesday’s CPI print.

Here’s the thing, inflation in Australia was in a beautiful disinflationary trend up until 2024 when the monthly reading bottomed out at 3.4% from Q3 ‘23 September highs of 5.6%.
The May reading for inflation clocked in at 4%, as you can imagine, rate expectations in cash rate futures priced in a potential RBA hike in September.
Unfortunately for the RBA, the large inflation contributors came from rather sticky components as opposed to your volatile readings. Housing was up 5.2%, transport costs were up 4.9% and alcohol and tobacco topped the reading with a 6.7% price increase.

This theme of persistent and resurfacing inflation is evident throughout neighbouring G7 nations, the UK and Canada notably. Despite Rishi Sunak celebrating 2% “headline” inflation, services inflation in the UK is still 5.7% and in Canada both inflation and core inflation picked back up to 2.9% and 1.8% both up 0.2% vs the previous reading.
Thought of the Week
“So, how did the Presidential debate go?”
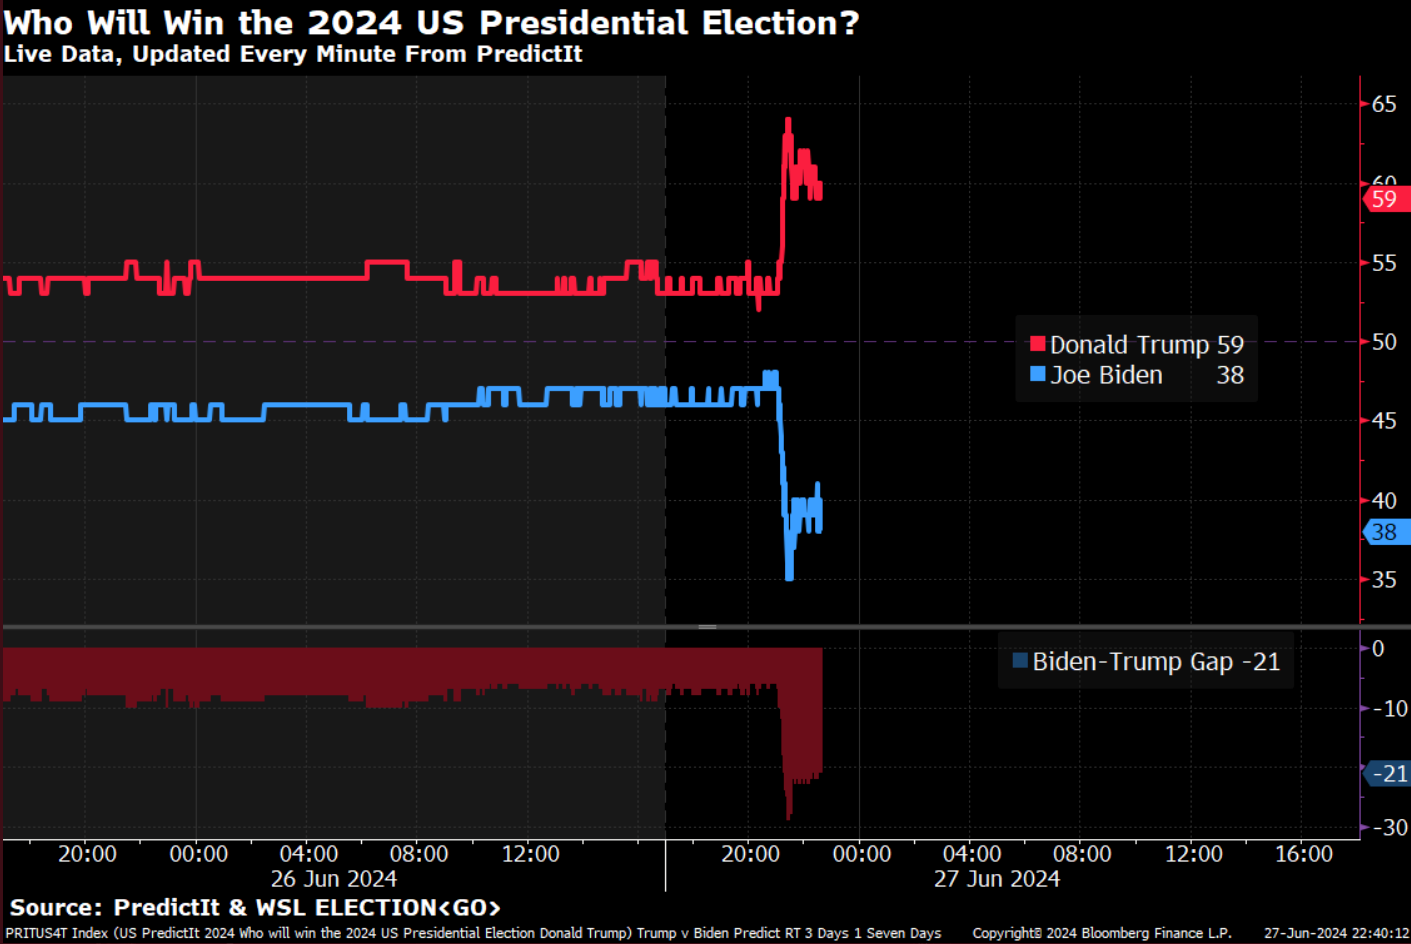
“Oh”
Last night Trump and Biden went at it in the Presidential debate; of no surprise bets of a Trump victory soared.
I know a few people were wisely positioned on Kalshi’s prediction platform for the debate.

Chart of the Week
If you missed my primer on currency markets then I recommend you go back and read it, (highly recommend):

Anyways here’s a snapshot of some ETFs that have managed to beat the incredible run of the S&P 500.

Mostly crypto-themed ETFs and a few fintech ones, but notice our Japan hedged equity index there— the power of (1) understanding currency risks & future central bank policy of G4 economies and (2) gaining exposure to such regions whilst hedging your currency risks ultimately profiting even if the domestic index underperforms.
Macro in its simplest form. Beauty.
The World of Treasury Auctions
For those of us fortunate to have worked within the fixed income space, despite it being a short stint for myself, we understand the true depths of this market and the weight it has across global macro.
Bonds are the glue of financial markets, the oil is liquidity.
I learnt that in the world of global macro and life, the most valuable commodity is knowledge, the rarest is time. Trade the rare for the valuable.
Piecing knowledge together in the world of macro is the second most enjoyable feeling, first is the when you finally get to apply that knowledge and it moves from theory to application. Blissful I tell you, blissful.
For the most part, if all you focus on is FX, or even equities then getting a grip on treasury auctions and their importance will not be relevant. However, if you want to be able to move across markets freely, then understanding the importance of treasury auctions is something you must comprehend.
This primer is designed to be clear and concise, perfect for those new to the world of global and bond markets. For my seasoned FI people, you can benefit from a refresher, revisiting the fundamentals and reviewing the recent 2Y & 5Y auctions from this week.
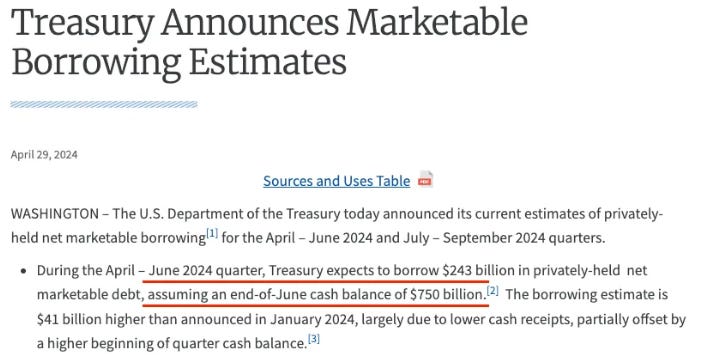
Earlier in April the Treasury released its quarterly refunding announcement, and most notably disclosed that borrowing for Q2 would be $41 billion higher than previously announced. The Treasury Department also stated that they expect to assume an end-of-June cash balance (TGA) of $750 billion.
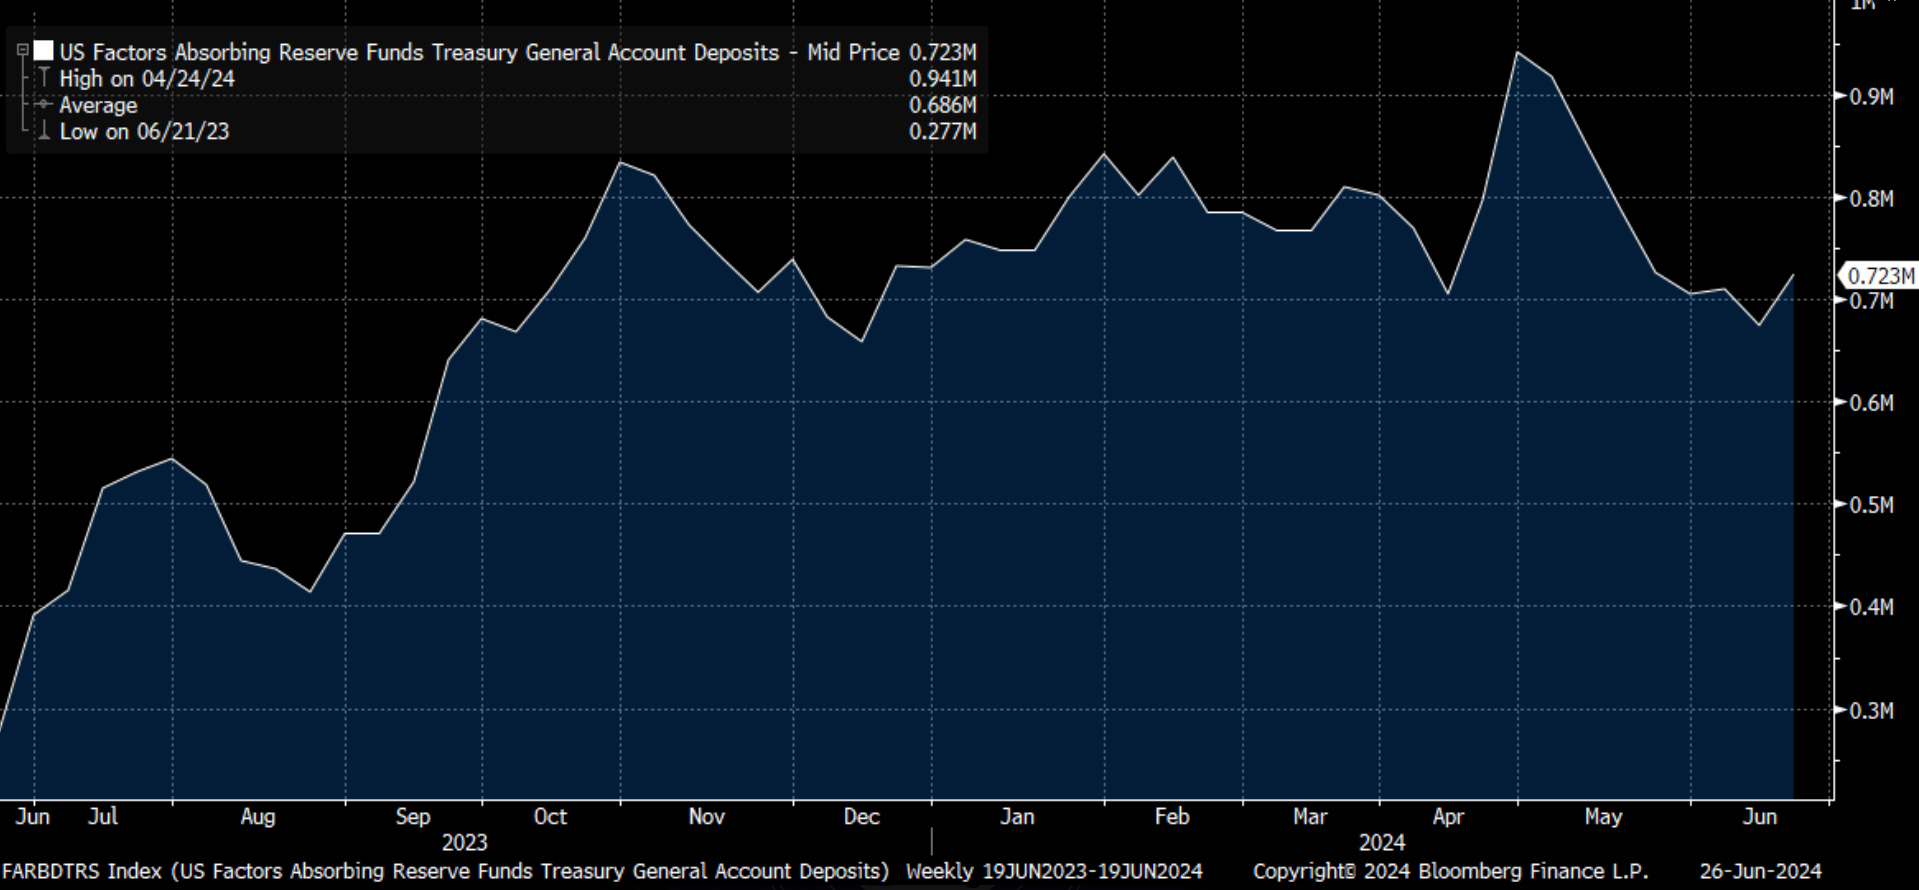
Looks close enough as of Wednesday.
First, let’s understand the reason and purpose of treasury auctions. There are two primary reasons the Treasury Department issues bonds through Dutch auctions (we’ll get onto that name later).
Financing the government: As everyone and their uncle knows, the U.S runs a fiscal deficit, meaning that in order for the government to service financial commitments they must issue bonds.
Indirect monetary policy tool: Whilst I say indirect, treasury auctions are one of the most direct methods of changing the yield curve. I say indirectly since it’s not a tool under the control of Jay Powell and his colleagues, but as you can imagine the size of auctions can heavily influence interest rates.
Now for the auction fanatics, yes, there may be a few other reasons, but let’s be honest, these are the main ones.
It’s important to know that the outcome of treasury auctions sends signals to the broader financial market. Strong demand for treasury auctions can imply greater investor confidence in the economy, shifting short-term rates lower.
Now, let’s really dive into the structure of auctions.
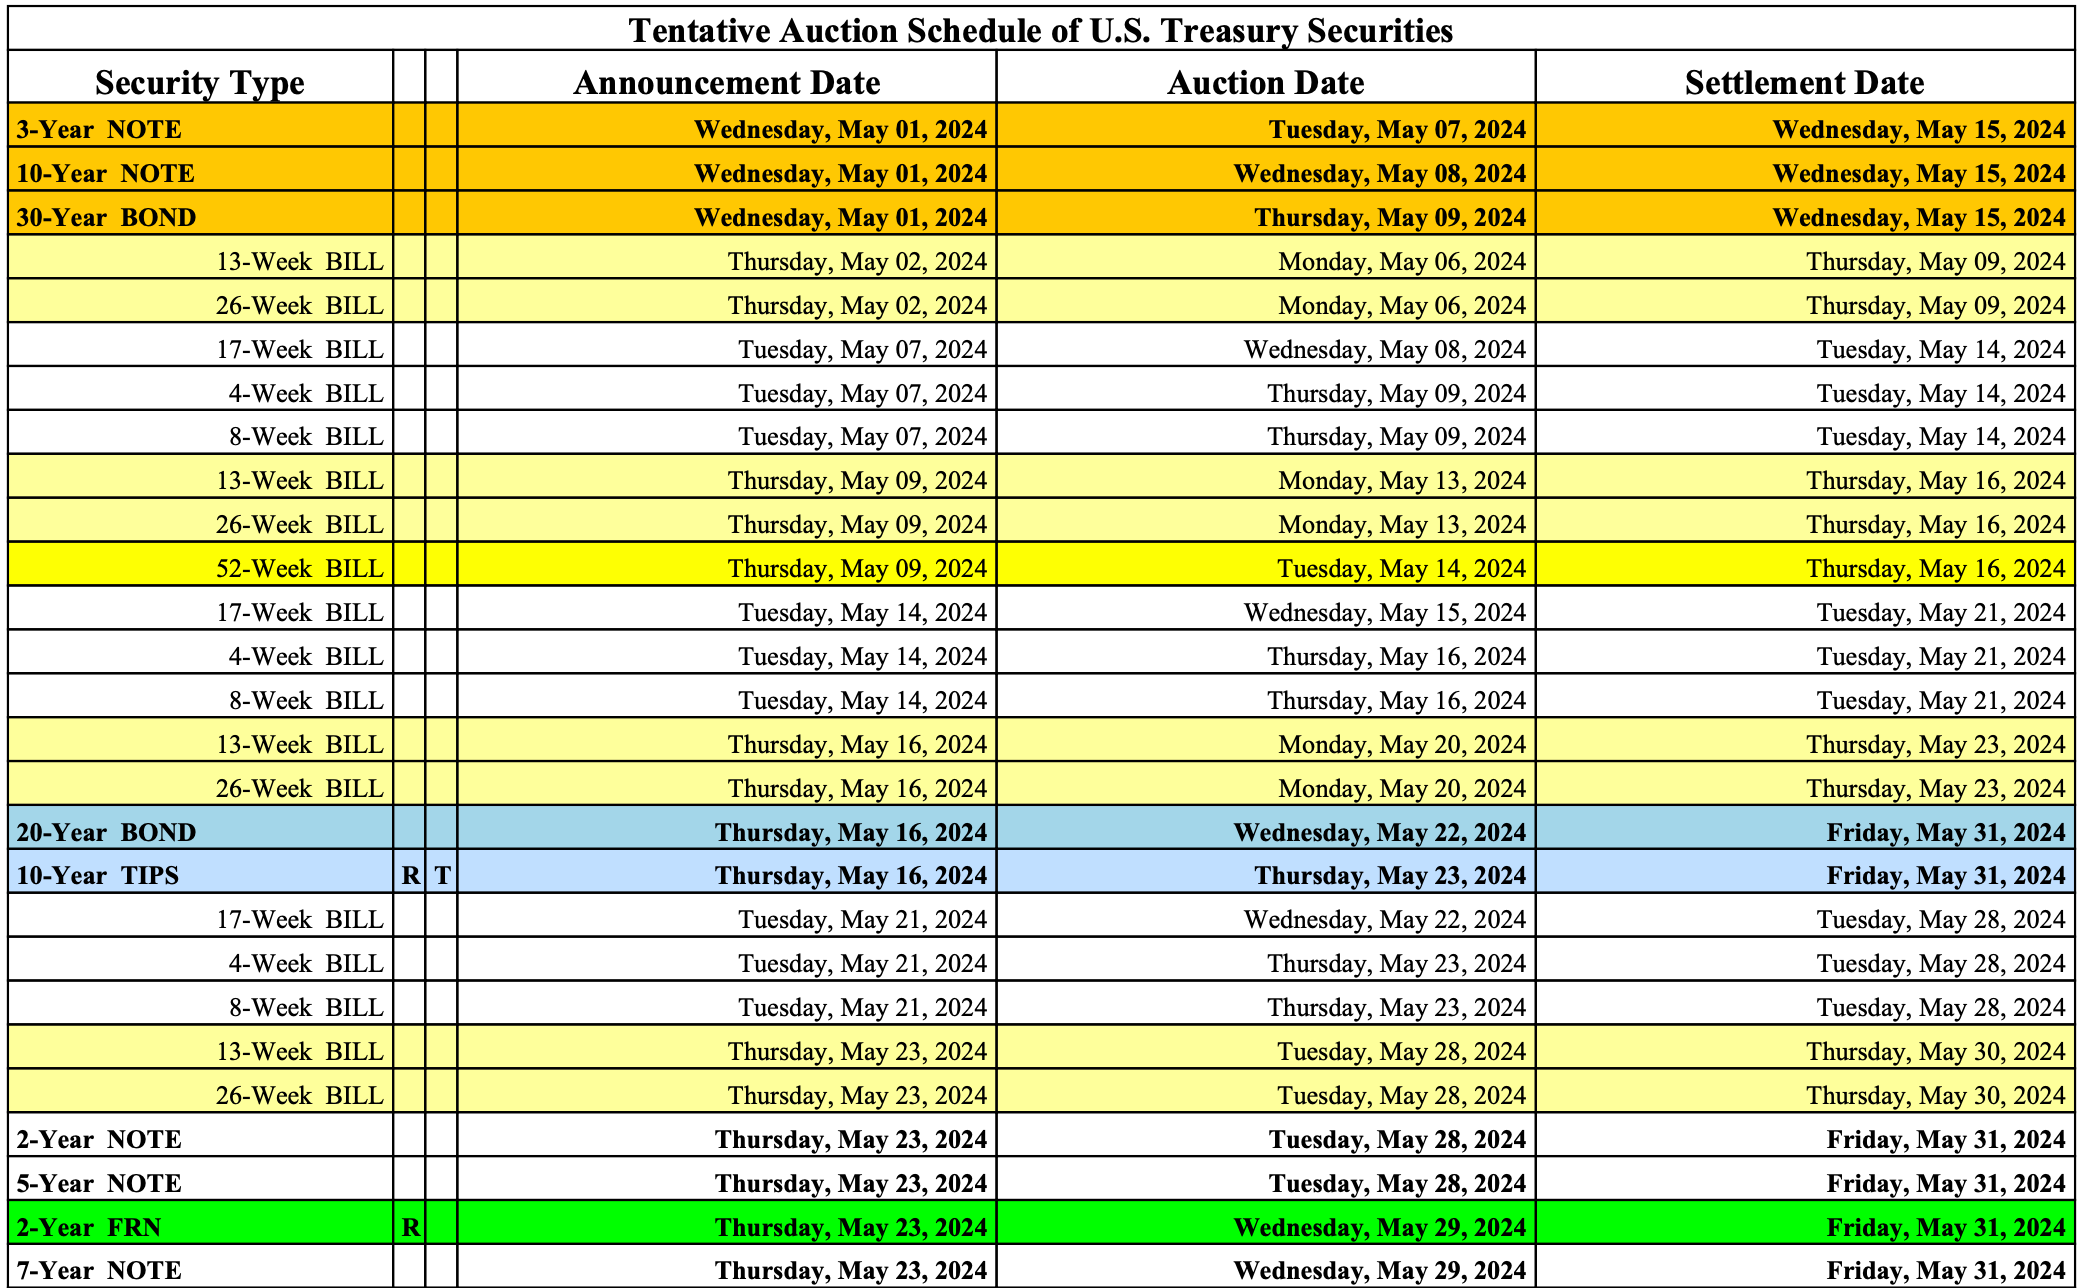
This is the schedule of the Treasury auctions through to October 24th ‘24. Treasury auctions are done in a Dutch auction format, meaning, participants submit a yield in which they’re willing to purchase a certain amount of treasuries being auctioned. The Treasury reviews the bids and figures out the highest yield they need to sell the securities at to fill the auction. The Treasury awards the security to the highest bidders (lowest yield), up to the offering amount.

The offering amount you see here is generally the amount the Treasury wants to raise based on its estimated borrowing needs released in the quarterly refunding announcement (QRA).
In an auction, the lower the demand for the security, the higher the yield the Treasury has to offer to incentivise investors so the auction can be filled. In the example above you can see how the Treasury planned to offer $44 billion of 7-year notes which took place yesterday.
Dissecting an Auction Result
Before we get into the mechanics of treasury auctions it’s important to know who the main players are.
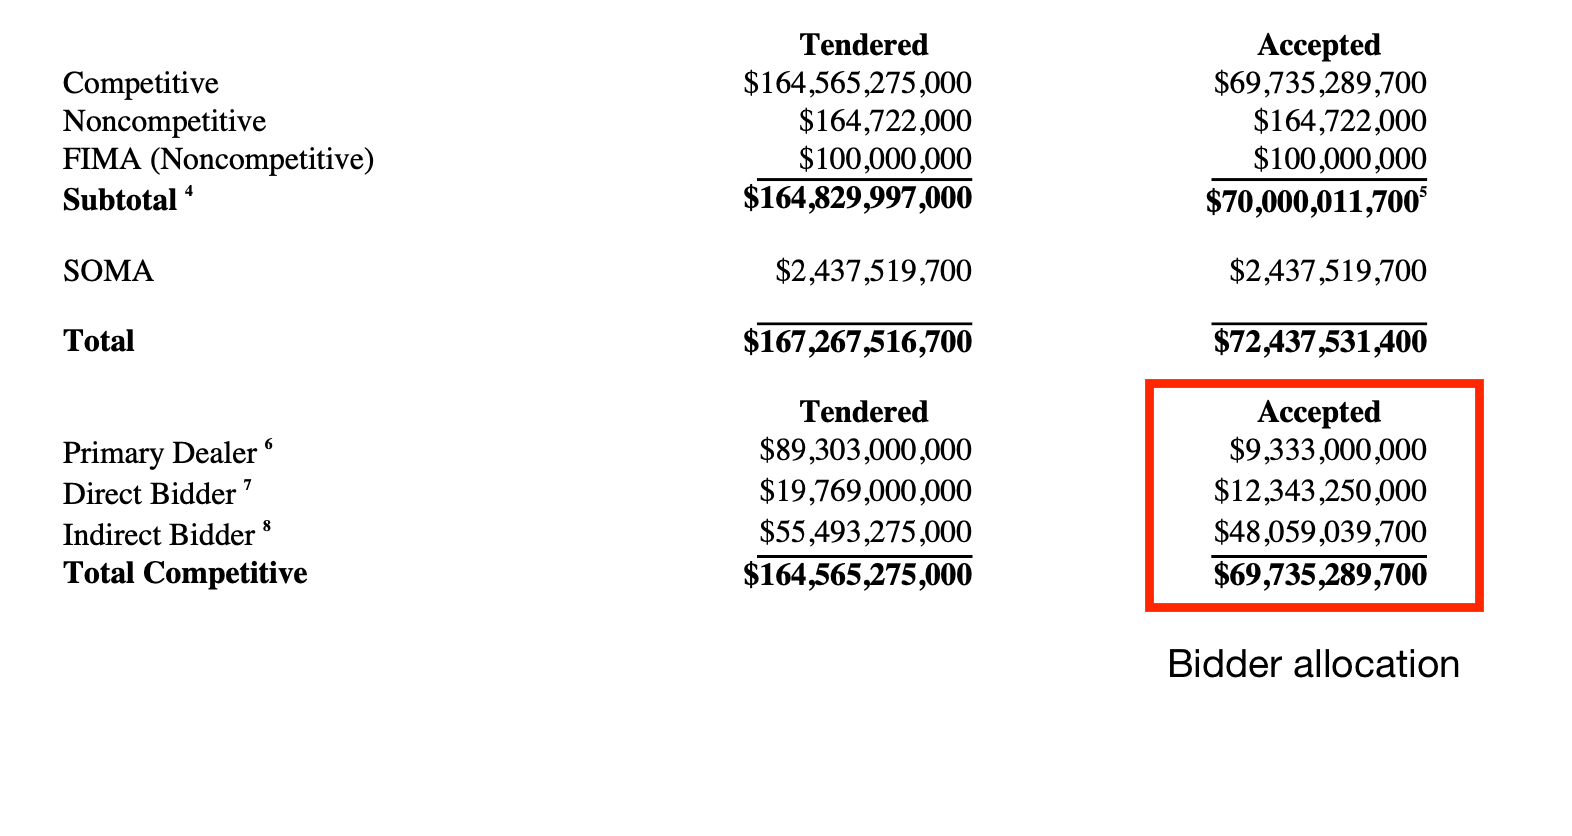
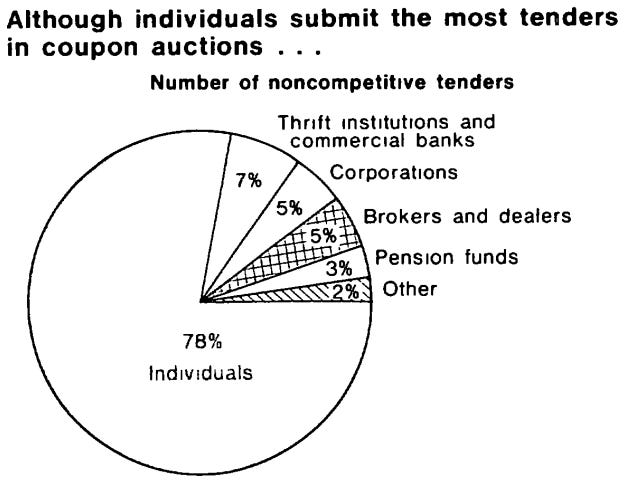
The auction is split into the competitive bidders and the noncompetitive bidders. Starting with the latter, your non-competitive bids are a way for your smaller investors, commercial banks, corporations, brokers and pension funds to get involved in the auction. These bids are significantly lower than the competitive bids, the good thing is these non-competitive bids get a guaranteed spot in the auction, as such they do not get to choose the interest rate they want for the security.
In the analysis of non-competitive tenders, a total of $164,722,000 was submitted, and the Treasury Department accepted the entire amount. Quick rule of thumb, every participant in a Dutch auction receives the same yield once the auction is settled.
Your competitive bidders are compromised mainly of your dealers. In the US there are 24 primary dealers, the typical names you would expect, GS, JPM, Nomura, Wells Fargo, Morgan Stanley, Citigroup etc. These guys are required to bid in auctions. These primary dealers select a yield they want to purchase the security being issued at, and if the Treasury reviews the bid and is willing to accept their offer only then is the competitive bid accepted. That is why the total competitive bid is $164 billion but only $69 billion was accepted.
The Treasury Department strives to achieve a delicate balance in its auctions. Their primary objective is to fill each auction. However, they also aim to minimise their borrowing costs by securing the lowest possible yield on the debt they issue.
Auction Results Explained
In an auction, there are two elements that the market focuses on and thus you should focus on, the bid-to-cover ratio (BTC) and the tail.
The bid-to-cover ratio is simply the amount of demand divided by the supply. Take Wednesday’s $70 billion 5Y auction, this is how you would break it down to understand whether it was a good or bad auction.

At the bottom of the treasury auction results, you will always find the BTC in the footnotes. Here, for the $70 billion 5Y auction on Wednesday the 26th, the BTC was 2.35, meaning, for every $1 of security ready to be auctioned there was $2.35 in bids. That sounds great, right? Solid demand for an auction—not quite, you see the cover (bids) can be manipulated or inflated by dealers submitting bids significantly below the expected auction price of the bond, which would make it seem as if there was a lot of demand for the bond but in reality the dealers know very well the treasury will not accept such low bids for the securities. They do this to ensure the BTC looks healthy.
For that reason, that is why we then look to observe tails and the stop-through of auctions. You guessed it, the trade through/tail cannot be manipulated by dealers.
The tail is slightly more complex but fairly simple to grasp after this analogy; the "tail" refers to the difference between the final auction yield and the yield that was anticipated by the market beforehand. This anticipated yield is often based on futures market pricing.
Stay with me now.
For this, we need two simple numbers, the High Yield (the highest yield the Treasury had to offer to fulfil the auction) and the WI Yield (When-Issued Yield) the unofficial estimate of the potential yield investors might receive on the bond auction.
Tail/Through = High Yield - WI YieldIf the High Yield is greater than the WI Yield, then the bond auction “tailed”, which is a negative sign as the Treasury had to offer a greater yield to fulfil the auction(low demand). However, if the High Yield is lower than the WI Yield the bond traded through or “stopped through” which is a strong sign of demand for treasuries. In the case where the High Yield is in line with the WI Yield then it “stopped on the screws”, i.e. met the expectations.
So, an auction that tailed by a large number of bps is negative and a stop-through is positive for an auction.
Now, like anything in macro, you can’t just look at one bond auction and decipher whether it was a positive or negative auction, you need to compare it against previous historical auctions for the same maturity.

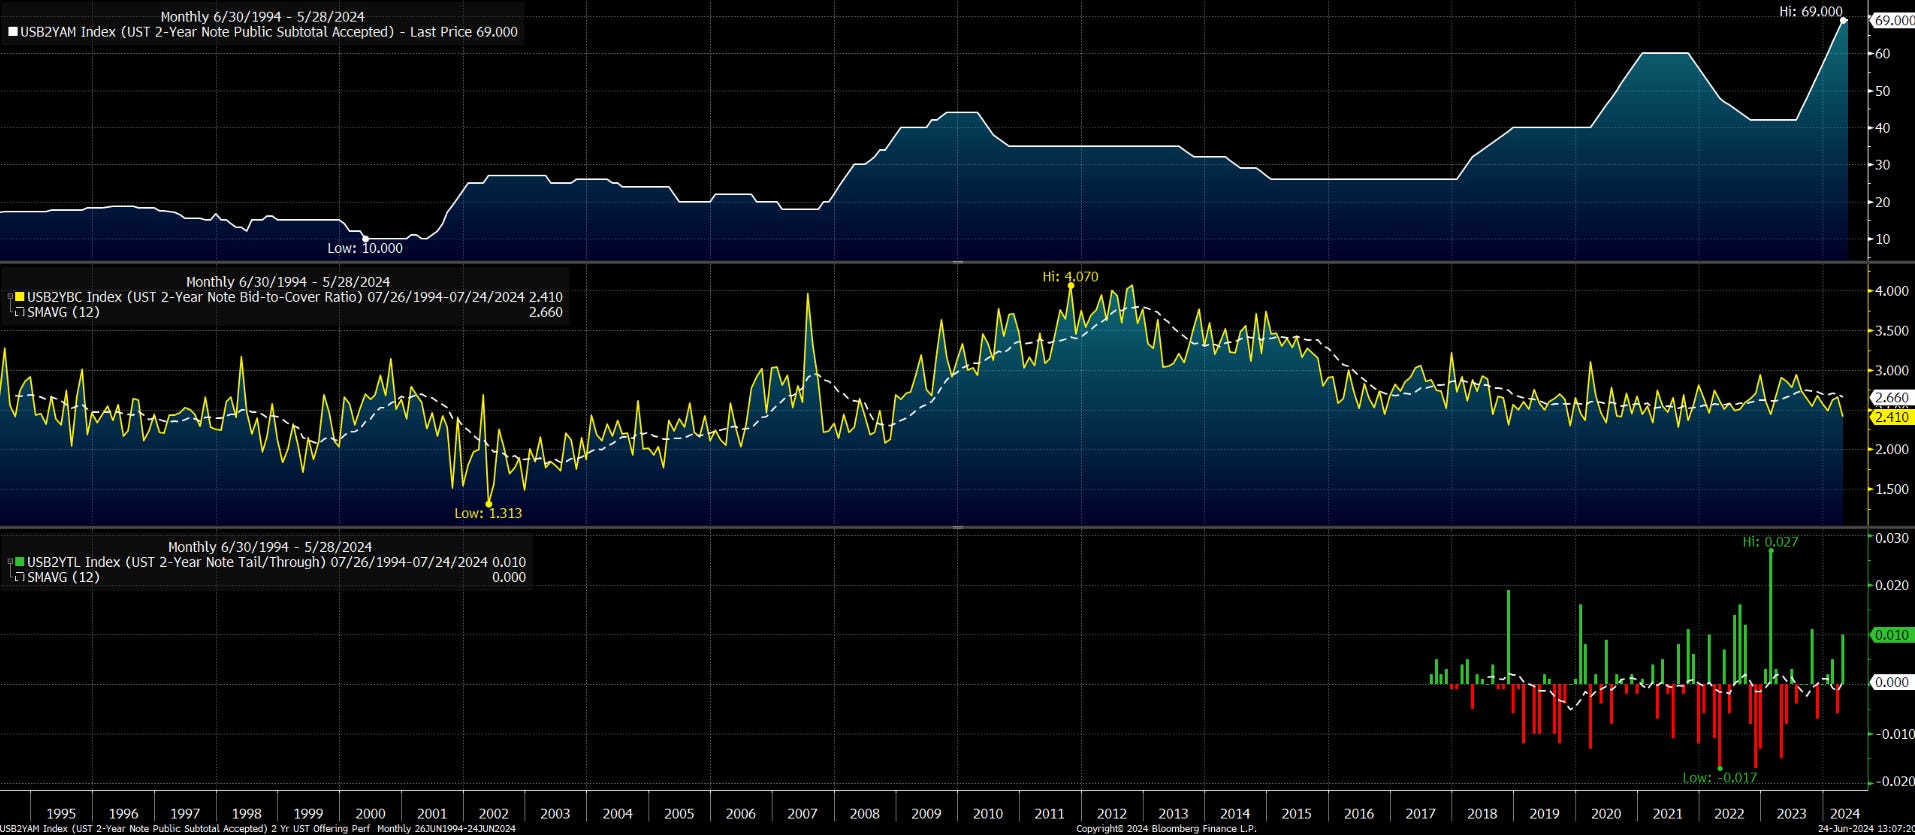
Let’s take the 5Y bond auction from Wednesday, the top chart above shows the monthly accepted bids for the 5Y treasury note in billions of dollars from June ‘94 to June ‘24. The most recent record was a high of $70 billion this past Wednesday.
The middle chart shows the BTC ratio from ‘94 till date, this provides us with clarity on how good demand is ‘relatively’ for the given auction compared to previous auctions for this security. For the large part, the bid-to-cover ratio is consistent although the last few auctions have seen the BTC drop below the 12-month moving average (white dashed line).
The bottom line represents the most important component, the tail/through. Positive values (green bars) indicate a “tail” meaning the High Yield was higher than the WI Yield, whilst negative values (red bars) indicate a “through”, meaning the High Yield was lower than the WI Yield.
For this auction we can see the High Yield stopped through the WI Yield by 0.4bps, signalling a strong auction result for the 5Y Note.
On Tuesday this week, we had a $69 billion 2Y auction which stopped on the screws (as the High Yield of 4.706% was in line with the WI Yield). The chart above shows the BTC up until May’s 2Y auction, which was 4.1%. The June auction for the 2Y rose to 2.75 as seen in the footnotes of the auction result.

This was a strong auction, the absence of tails, and stop-throughs tells us the market efficiently absorbed the additional issuance from the Treasury.
You can find all auction results on Treasurydirect.com.
The main focus for understanding auctions is to be able to decipher the health of the auction market, whether there is ample demand from participants to fill the auctions from the Treasury and what effect/move we may see on the yield curve as the auction calendar unfolds.
With interest rates elevated auctions have become somewhat of an attraction in macro as everyone’s focused on the yields being issued at these auctions to gauge the debt management of the Treasury. Overall, this is one component you would rather know, than not know if you plan on not only surviving but thriving in this global macro universe for the long run.
Anyway, I hope both new and experienced readers were able to derive value from this simple primer. There’s a lot more to uncover in the world of global macro, so I’ll be back at the drawing board tonight.
If you did enjoy it, could I ask you to forward this to a colleague or friend?
Thanks, it helps a lot.
Until next time!
Great explanation, simple and straight to the point. Did you build the BBG graphs yourself? I'll probably try to make some similar ones. Cheers mate