


What's The Macro Story?
Exploring the current macro climate and diving into data from China & the U.S

Hey guys,
It’s been three months since the launch.
And it’s been great.
Community growing, learning, building their edge with macro.
I wouldn’t have it any other way. I’ve got an announcement, I’ll share it pretty soon so be on the lookout.
Chinese data has been top of mind for me as I’ve watched the reopen from afar, NFP data came in today so I’ll be doing a clear macro breakdown of what I see happening.
As always lend me your attention:

Credit. The Building Blocks
It’s obvious that many traders and investors don’t understand the importance of credit creation within global macro.
Credit as we know, is the building blocks of development, progression and economic booms and busts. Just like oxygen, too much credit and you pass out, too little and find yourself in the same situation, out cold. There’s the perfect equilibrium where credit is growing and we find ourselves in a period in the markets known as ‘goldilocks’, where every macroeconomic data point is just perfect. Inflation is present, but not unsustainable, the labour market is strong but not too tight, the economy is growing and the stock market alongside all other high beta instruments is ripping through the roof.
This Goldilock period fits within the four different market regimes we experience in macro, the expansion, the peak, the contraction and the trough.
Next, we would want to understand the powerhouses that drive such periods of economic growth and strength as we saw in 2019 and 2021, where we the U.S produced double-digit equity returns and China had strong GDP growth across.
You guessed right.
China, but also India.

China alone accounts for over 1/3rd of global growth! India also plays a huge role due to its young and growing demographic, creating a large pool of workers and consumers, growing presence in global trade and their government pushing reforms to strengthen their economy and environment to strengthen businesses.
Together the two nations combine to account for 50.3% of global growth as of 2023.
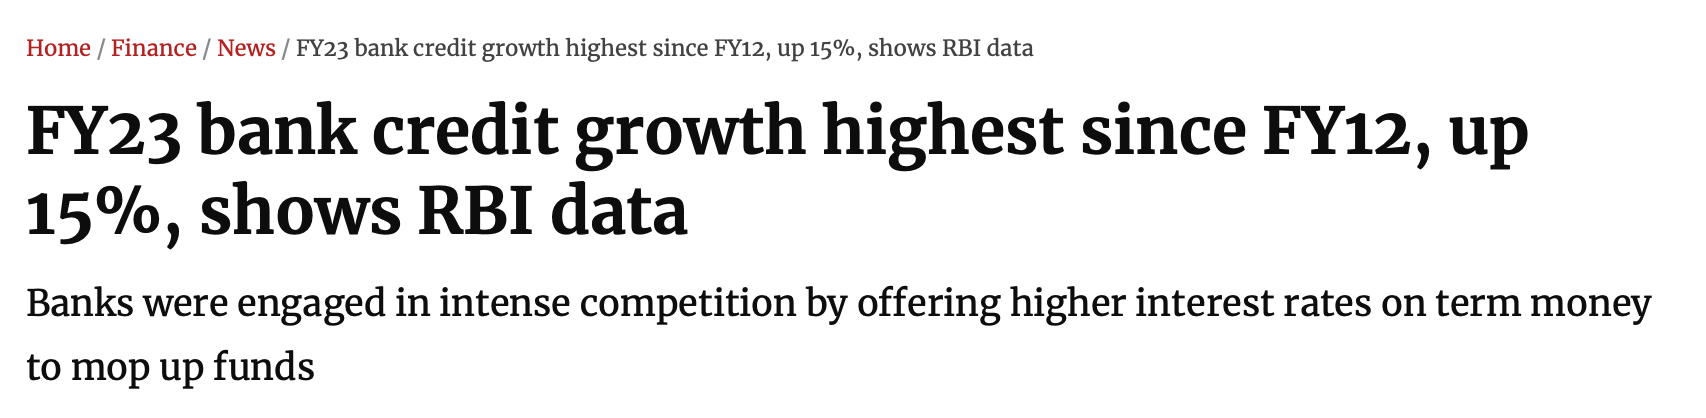
Now, looking at India from a bird’s eye view, all seems to be good. India is seeing the largest amount of credit growth for FY23 since FY12 and the IMF expect growth in India to moderate slightly to 5.9% from 6.8% last year. I came across a book by Steve Drobny, a renowned hedge fund advisor who spoke about how one would be wise to be long India as a whole due to its impressive growth and potential.
However, even with record-setting bank credit growth in India, global growth remains sour, that’s all to do with China.
Rewind back to January and the hedge fund industry took on large amounts of capital, as investors were overly optimistic of the “Chinese rally” fuelled by the reopening of the Chinese economy, but more because of the stimulus from the PBOC (People’s Bank of China) which was expected to push asset markets higher. It seemed everyone was long China re-open, but fast forward till today and that trade has far outlived itself not matching up to the market hype.
The impact of China’s reopening has been muted, as an effect of a weak rebound in economic activity across property, exports and imports. China is the world’s largest consumer of commodities, particularly Copper. Chinese first-quarter copper imports are down 12.5% YoY, with March’s import of 408,174 tonnes down 19% YoY as well.

I came across this chart and it’s surreal to see that amidst all the positive hype behind the China reopening that China’s net and imports came in at such low figures.
As a trader, analyst, or macro enthusiast you have to start thinking. If Chinese consumption isn’t living up to expectations and growth is slowing down, what does this mean for the Western economy? What effect does this have on commodity-correlated currencies such as the Aussie if Chinese demand weakens? What opportunities might be developing in the immediate to near-term future?
Just a few high-level questions which will help you collect your thoughts, and formulate potential scenarios to explore.
Fed Pause, Debt Ceiling Resolved, Yields
Alright.
It seems that the U.S managed to come to a conclusion about the debt ceiling debacle.
Throughout the week I, alongside MMH pro members paid attention to the ever-changing FOMC rate probability tool which went from one extreme to another.
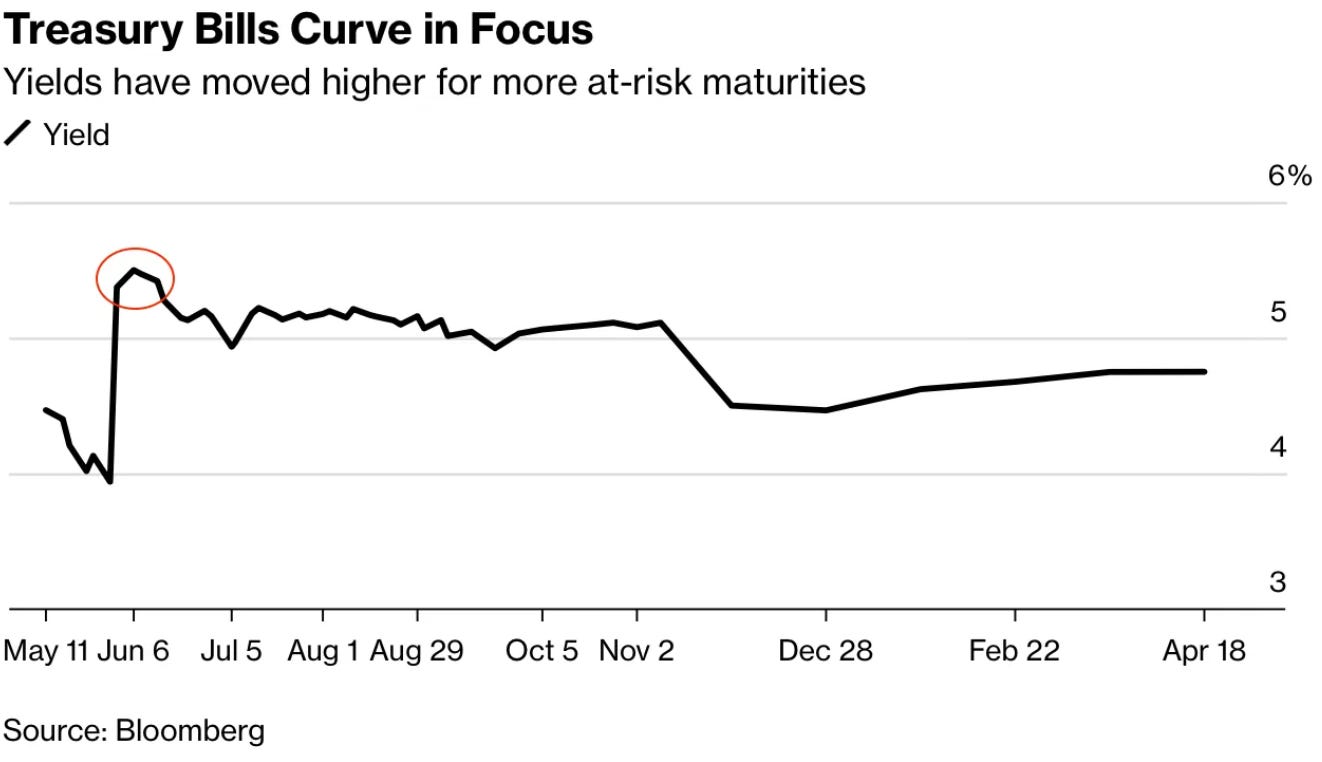
Closer to the X-date tension and volatility in bond markets began to creep up as investors who were holding securities that were set to mature close to the time the government would run out of cash demanded higher yields on those shorter-dated T-bills.
As a result, the front end of the yield curve saw a sharp rally as the price of those bonds sold off.
Looking at the MOVE Index, a growing favourite of mine, you can see that bond market volatility has now subdued itself after a steep rise leading up to June when we received news of a debt ceiling deal being agreed upon.

Non-Farm Payroll & Fed Rate Decision
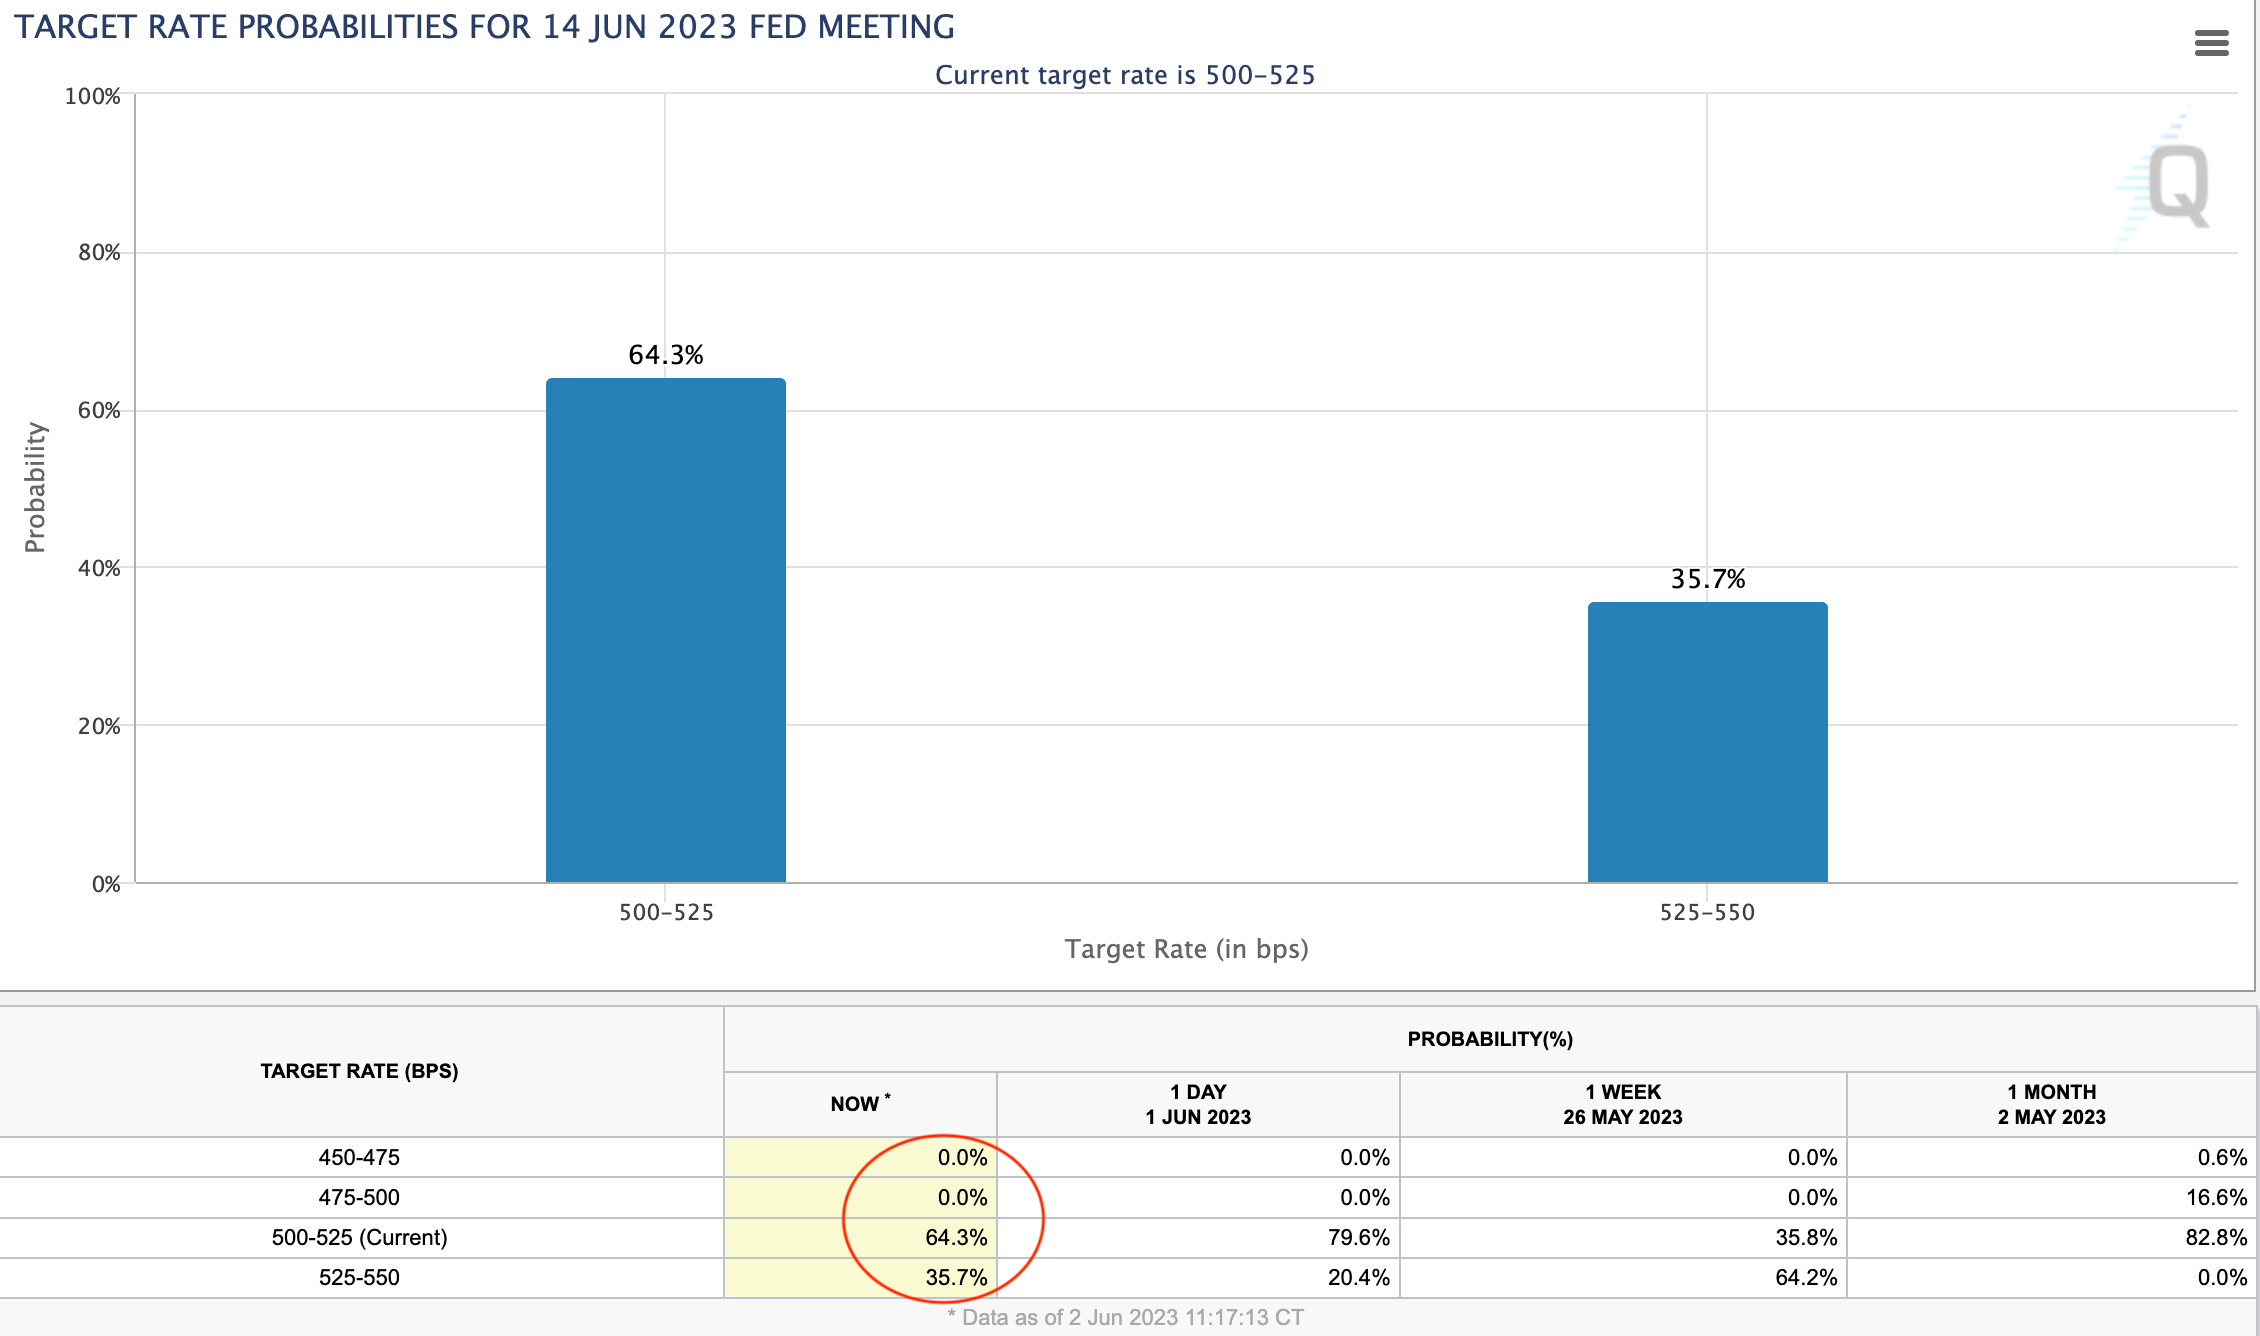
The speed at which markets can change, adjust and re-adjust their pricing on macro events is second to none. On Wednesday we had strong jobs opening from the U.S, which sent markets almost fully pricing a 25bps hike at the upcoming Fed meeting in 12 days hence, the immediate short sell on Eur/Usd which was a result of the positive U.S data.


This was the CME Fed watch probability distribution as of 31st May after the jobs opening reading.

Within 2hrs and 30 minutes the Euro erased losses from the data print and this is how the target rate probability tool looked.
Fed member Governor Jefferson held a speech on financial stability and the U.S economy where he said:
"skipping a rate hike at the upcoming meeting would allow the committee to see more data before making more decisions about the extent of additional policy firming"
— Governor Jefferson
And that was enough for markets to run with a Fed pause at the upcoming FOMC meeting. With NFP today showing signs of the labour market loosening with the unemployment rate rising to 3.7% from 3.5% that almost sets in stone the fact that we will see a Fed pause.
Yes, we did see some stickiness in the AHE (average hourly earnings) and non-farm payrolls but the overarching unemployment rate, which is what the Fed is targeting if you recall their March SEP (summary of economic projections) release, is getting closer to their 4.5-4.6% unemployment target.
That’s it for today.
It’s been a great year so far.
A lot of progression and milestones but so much more to do, until next time MMH crew ;)