


Understanding The Cyclicals: A Primer
The Big III: Housing, Oil and Labour

Happy New Week!
The main goal of MMH is to democratise complex frameworks in macro, breaking them down into simpler bits. Remember, we remain “your home for digestible global macro insight.”
As part of our flagship primer series, we will continue delivering once a month. As always, feedback is highly welcomed — let us know what you’d like to see.
Okay, volatility can wait… we haven’t been short of VIX spikes since the 2025 start.
Grab your morning coffee (or tea) and let’s get into today’s business…

When I first started diving into macro, I’d always hear professionals (PMs, traders, investors, etc.) reference stats from housing, oil, and labour when trying to narrate current views on markets or even make future forecasts/predictions.
Now, come a decent way, it would be callous not to give credence when these names come up. With this primer, we aim to deliver a simple, concise framework on how these three sectors shape the way we view markets.
With a larger concentration of our audience’s primary attention on FX — sure, more focus on rather headline macros and central bank communication is sufficient in navigating those markets but for nuanced ability to glide across other markets with relative ease, expressing various views, then understanding cyclicals enables you to be well-positioned to do so.

Cyclicals denote business cycle themes and point to a positive correlation with respective sectors of macro. As the figure above points out, a typical business cycle takes us from recovery—expansion—slowdown—and contraction.
Cyclicals are industries that have high beta and move in lockstep with the prevailing business cycle, outperforming during the growth cycle and underperforming during contraction cycles or, for lack of better words, a recession. When markets are performing well, we usually see these industries lead the way: technology, consumer discretionary, financials & industrials, etc.
If we survey 100 investors about current markets, we’d get a plethora of observations, from the doom dwellers to Perma bull junkies and many more in between. A glance at the previous week’s heat map, and it’s not an over-exaggeration to say markets are pretty much comfortably ripping through grim headlines.
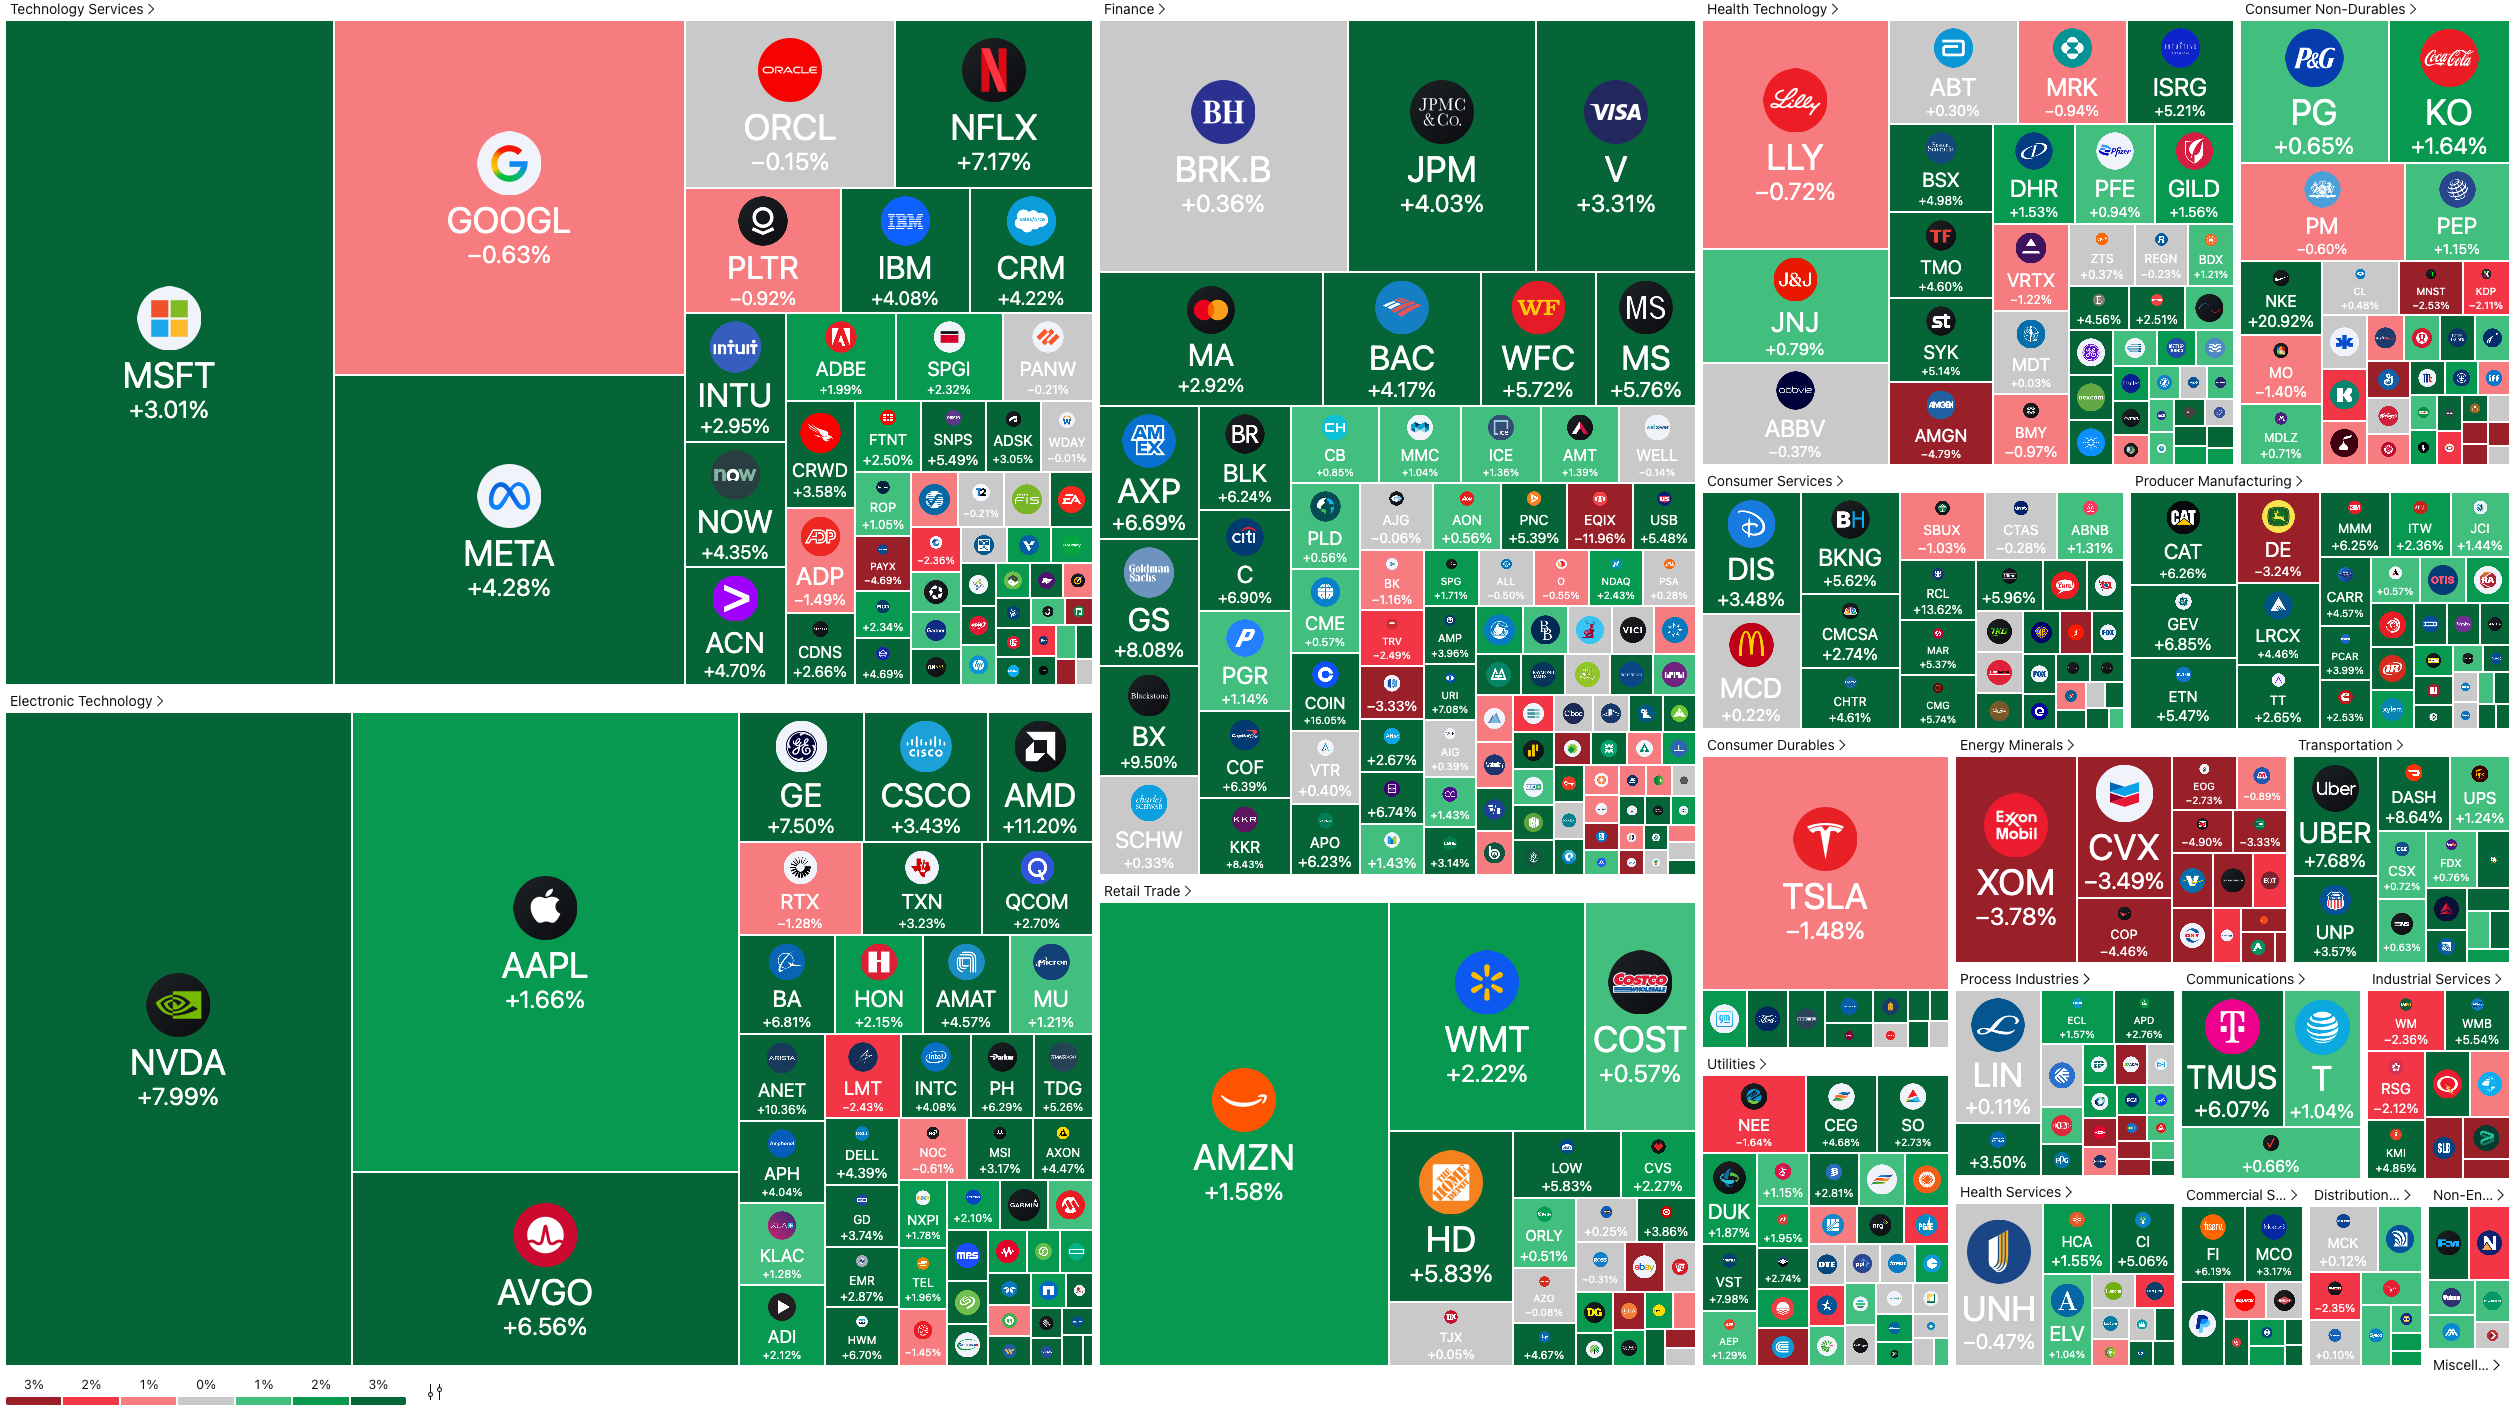
“Oil tail risk,” “cracks in the labour market,” “built-up inventory in housing”, “trade war“… all talking points crowding the macro commentary this past month. Did I miss anyone?
…Yet, incoming ALL TIME HIGH!!

I’m not stating this to primarily dismiss such concerns, but as we’ve seen this year, it doesn’t take much “positive” news to get markets riled up again. However, this is the caveat as macro traders: the beauty of macro is far from being exposed to just beta. Sure, timing leverage on going long beta is a skill set, but the essence is in seeking asymmetric opportunities across equities, FX, rates, credit & commodity — that’s alpha.
As we close H1, a few thematic trades which underpinned prevailing narrative:
Dec SOFR repricing a few cuts this year, betting on more next year as tariffs were rolled back and a Fed comfortable playing the waiting game
Gold rally as US uncertainty premium spiked (fiscal deficit, trade war & RoW CB demand)
EURO, next-door diversifier benefiting from US Dollar demise as the Eurobloc steps up, fiscally
USDJPY sell-off on policy divergence and Yen safe haven flow
Essentially, whatever your macro view was, there have been more straightforward ways to express them rather than binary thinking:
economy good/bad =long/short S&P500
For example, say you have a bullish view on China playing into long CNY would not be the ideal way to go. Why? China’s economy is currently flirting with deflation, benefits from a depreciating ccy (trade balance surplus), and maintains a peg. A rather effective way to capture direct upside would be owning exposure in long HSI index or CSI 300 due to demand for international markets. For FX, long beta CCY like AUD, which benefits from global demand, with China as a benchmark.
Moving on, where there are cyclical sectors, there also exist non-cyclical. These sectors are seen mostly as a stable hedge in the face of economic slowdown or even a recession; they provide that offset. The rationale here is simple: in any functioning economy, certain expenditures are non-discretionary. Households may defer travel or tech upgrades, but they won’t stop buying food, paying utility bills, or seeking healthcare. Industries that cater to consumer staples, utilities, and healthcare are underpinned by structural demand. Their earnings profiles are less sensitive to the business cycle, making them defensive allocations in risk-off environments.
POV— Cyclical Drivers
So far, we know that when people talk about cyclicals, it's about the rise and fall in the economic cycle. However, let’s take it a step deeper. The true cyclicals aren’t just surface sectors that fluctuate; they’re mechanisms that amplify or reshape the cycle itself. We refer to them as cyclical drivers, and they are the focus for today.
Housing & Labour: The Yin & Yang of Boom and Bust Cycles
You can’t spell labour without housing—well, metaphorically at least. Let’s break it down. When we think housing, it’s less to do with ‘shelter’ and more to do with credit flow. Simply put, the housing sector is a credit cycle on steroids, quickly leveraging economic booms and, in turn, highlighting its vulnerabilities.
It’s by far the longest-duration and most interest-rate-sensitive asset class in the economy. When central banks adjust policy rates, the housing sector absorbs the shock, first transmitted via mortgage rate repricing, shifts in credit availability, and the widening or tightening of yield spreads across household credit markets.
From a first-principles perspective, rate cuts reduce the cost of capital, increasing the affordability of mortgage credit and stimulating demand across the housing market. Rising home prices feed through via the wealth effect, which supports consumption. We then see new residential investment scale up, generating employment and boosting aggregate demand. monetary policy transmits its way through housing via pulling forward economic activity through credit creation, and amplifies cyclical momentum via its intensive use of upstream commodities, lumber, steel, copper, and energy. In this sense, housing is not merely interest rate-sensitive it’s credit-sensitive and commodity-linked, making it a high-beta sector that reflects and reinforces the broader macro cycle
This creates self-reinforcing dynamics: loose credit and demand pick up in mortgage financing; rates unlock higher prices, unlock home equity, which fuels consumption. Construction ramps up, feeding demand for materials and labour. The cycle accelerates.
Broader Labour Market
This is where labour data sits on the receiving end. Labour markets don’t lead the business cycle but it does lock in its consequences. So it pays, therefore, to look closely at the pockets of the labour market that offer leading signals, residential construction payrolls offers insight as key proxy. While housing-related employment accounts for just 4%–6% of total nonfarm payrolls, its cyclical sensitivity is disproportionately high. In a scneario where financing costs rise and credit availability tightens, hiring stalls, projects pause, and layoffs begin often setting off the first visible wave of labour market softening before it filters into the broader economy. This offers a leading indicator for broader employment trends overall, because builders stop hiring before consumers stop spending, permits decline before retail sales fall, job cuts in construction precede weakness in manufacturing or services.
This anticipatory nature is why must pay attention to metrics such as housing starts, construction payrolls, and homebuilder sentiment so closely. When these roll over, it's usually a prelude to a broader labour market slowdown.
In data releases, this is where we tend to see the lead and lag effect in HD. This structural lag stems from the way shelter inflation is calculated. Shelter, which makes up roughly one-third of the CPI basket and about 77% of the shelter component, is based not on real-time home prices or construction costs but on rents and Owner’s Equivalent Rent (OER), a survey-based estimate of what homeowners would pay to rent their own homes. These surveys are infrequent, with leases often updating only once annually, meaning that CPI shelter inflation reflects past rental conditions, not current market dynamics. As a result, even if market-based indices like Zillow's Rent Index (ZRI) show a clear peak in real-time rents, this disinflation takes quarters to filter into official inflation reports.
Powell summarised this well:
“Housing inflation tends to lag other prices around turning points… because of the slow rate at which the stock of rental leases turns over.”
Overall common mistakes are usually over relinace on just headline unemployment. In most cases by that time those figures take on gory forms, the demand is well and truly done. As this lead proxies just discussed more timely signals also include:
Job Openings (JOLTS): gauges hiring appetite.
Quit Rate: captures worker confidence.
Wage Growth: tells you about price pressure.
Wage pressure is particularly important to note because In tight labour conditions, firms are compelled to bid up wages or enhance compensation structures to attract scarce talent. This dynamic elevates household income, reinforces consumption, and props up housing demand. Inflation only then becomes a problem when the pace of wage growth hikes run hotter than productivity. In this scneario it result in Push Cost shove in prices down to final consumers.
Scenario Analysis: Pre-GFC ’08 vs Post-Covid ‘19
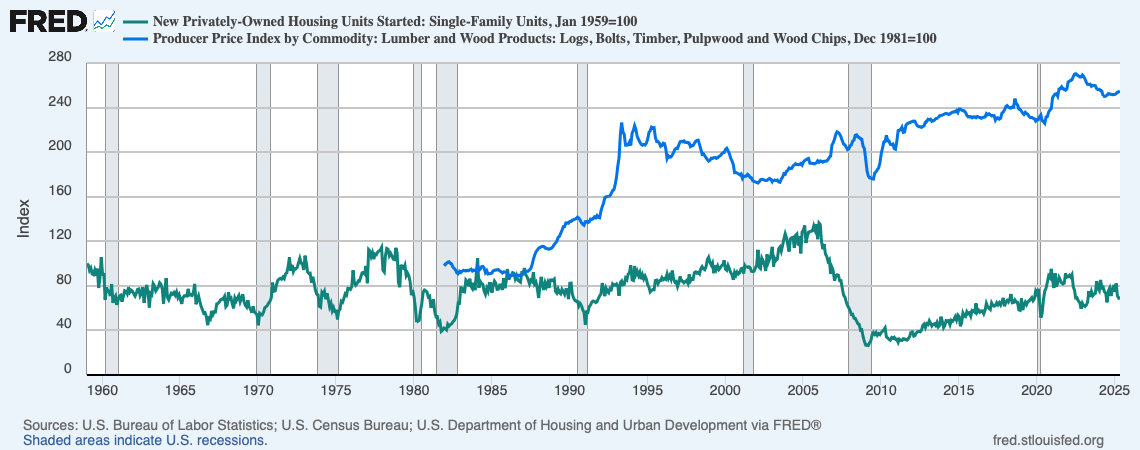
The ‘08 GFC remains the benchmark for housing-led recessions. That crisis was rooted in an unsustainable housing bubble fueled by lax lending standards, adjustable-rate mortgages (ARMs), and speculative home buying. Leading into the GFC, single-family housing starts experienced a dramatic decline, in excess of 40% signaling the contraction of credit and consumer demand that soon rippled through the entire economy.
Historically, from 1980 through 2010, every U.S. recession was preceded by a significant pullback in single-family housing starts. These declines varied in magnitude but consistently served as a reliable leading indicator of economic slowdowns. For instance, the early 2000s recession following the dot-com bust saw a more modest housing starts decline, around 15–20%, reflective of a less housing-driven cycle.

Contrast this with the post-Covid era. Housing starts peaked amid the pandemic’s initial stimulus-fueled boom, with demand surging due to record-low mortgage rates, a flight from urban centers, and shifting work-from-home trends. However, as the Fed began aggressively tightening monetary policy in 2022, SF housing starts contracted sharply. This sizable decline rivals pre-GFC magnitudes but, notably, the economy narrowly avoided recession.
Its difficult to pin an exact reason, however when looking at this a few factors look to be in paly differntiating this post-Covid scenario from the pre-GFC environment:
ARM vs. Longer-Run Lock Rates: Pre-GFC housing stress was exacerbated by widespread adjustable-rate mortgages resetting higher, mix that No Income No Job No Asset NINJA (fans of the Big short should easily recognise that, superb movie) causing sharp payment shocks and foreclosures. Today, the majority of mortgage debt consists of fixed-rate loans locked in at historically low rates during the pandemic. This “longer-run lock” reduces immediate refinancing risk and payment volatility, cushioning households from sudden financial distress despite higher current rates.

Pro-Cyclical Fiscal Deficits: The government’s fiscal response during Covid was far more aggressive and sustained than during the GFC, with trillions of dollars in stimulus payments, expanded unemployment benefits, and credit support programs and has maintained an increased trajjectory ALL while econmy demed to runing historical low UR and 4%-5% NGDP. These measures bolstered household balance sheets and consumption capacity even as credit conditions tightened, creating a buffer against a sharper economic downturn.
Builders’ Inventory Management: Unlike the pre-GFC period, where speculative building drove excess supply, today’s homebuilders are operating with tighter inventory and more cautious construction plans. Many have adopted “builders buy down” strategies—offering price incentives to accelerate sales without pushing prices down aggressively. In plain emnglish this primarly reduces the financing cost whilst preserving home value.
OG Oil
First Principle: Traditionally, we are meant to think of oil as a proxy in measuring demand, but understanding oil starts with two essential truths:
Oil is an inelastic but indispensable energy source.
Oil prices aren’t set in a vacuum , they’re subject to a geopolitical premium.
The former offers this asset class a structurally privileged position within the macroeconomic system. We’ve seen nations like Germany try to pivot toward renewable energy but can’t escape with a clean break. Its inelasticity lies in the fact that aggregate demand for crude does not meaningfully adjust in the short run to price fluctuations.
The global economy’s physical infrastructure from transport, shipping, industrial production, agriculture is deeply coupled to petroleum-based energy. This binding constraint makes oil a direct transmission channel for supply-side shocks into headline inflation, by passing the conventional demand channel central banks are equipped to manage.
Monetary tightening in response to oil-driven inflation does little to alleviate the supply imbalance, yet it amplifies downside risks to growth producing more or less stagflationary conditions. On the other side is a policy tug-of-war as well, with OPEC, which may cut or increase production strategically to influence prices and geopolitics.
Market relevance
Because short-term demand elasticity for energy is low, neither consumers nor producers can easily substitute away from oil when prices spike. This makes oil a potent source of cost-push inflation feeding through production chains, transportation, and utility bills. Central banks, particularly the Fed, typically look through these energy-driven swings, viewing them as volatile and transitory, and instead focus on core inflation metrics that exclude food and energy. But while oil may be excluded from core readings, its second-round effects often bleed into core goods and services, via higher input costs and pricing behaviours
Given the current macro backdrop views on oil are increasing difficult to navigate. For one markets are now tasked with filtering the aggregate effect of more Saudi barrels back in market, July 9th reciporcal tariff coming back potentially disrupting trade flows and lastly, conflicts in the Middle East.
Thats a wrap here guys.
We hope the next time you’re parsing headline figures, you’ll think a level deeper: beyond the first-order effects. The real signal often lies in how the micro channels through the macro. Stay sharp, stay curious!
Good article to start the week, learnt something new!