

Trading The Yield Curve: Pt 2
Trading The Yield Curve: Pt 2
Beyond the Basics: Unveiling the Nuances of the Yield Curve

Hey crew,
This report was meant to go out last night, so thanks for your patience!
You’re all due for a life update, will be back next week to fill you all in.
Last week we delved into the different properties of the yield curve— today I want to go slightly deeper into more nuanced features of trading the curve and the different pieces of knowledge one must have not just for trading the yield curve but for fully grasping the global macro trading universe.
Before we do such, let’s take a look at the macro snapshot, thought of the week and chart of the week with you all.
The Macro Snapshot
What happens when you front-run policy cuts and then get hit by an influx of policy-opposing data?
You get a bullish dollar.
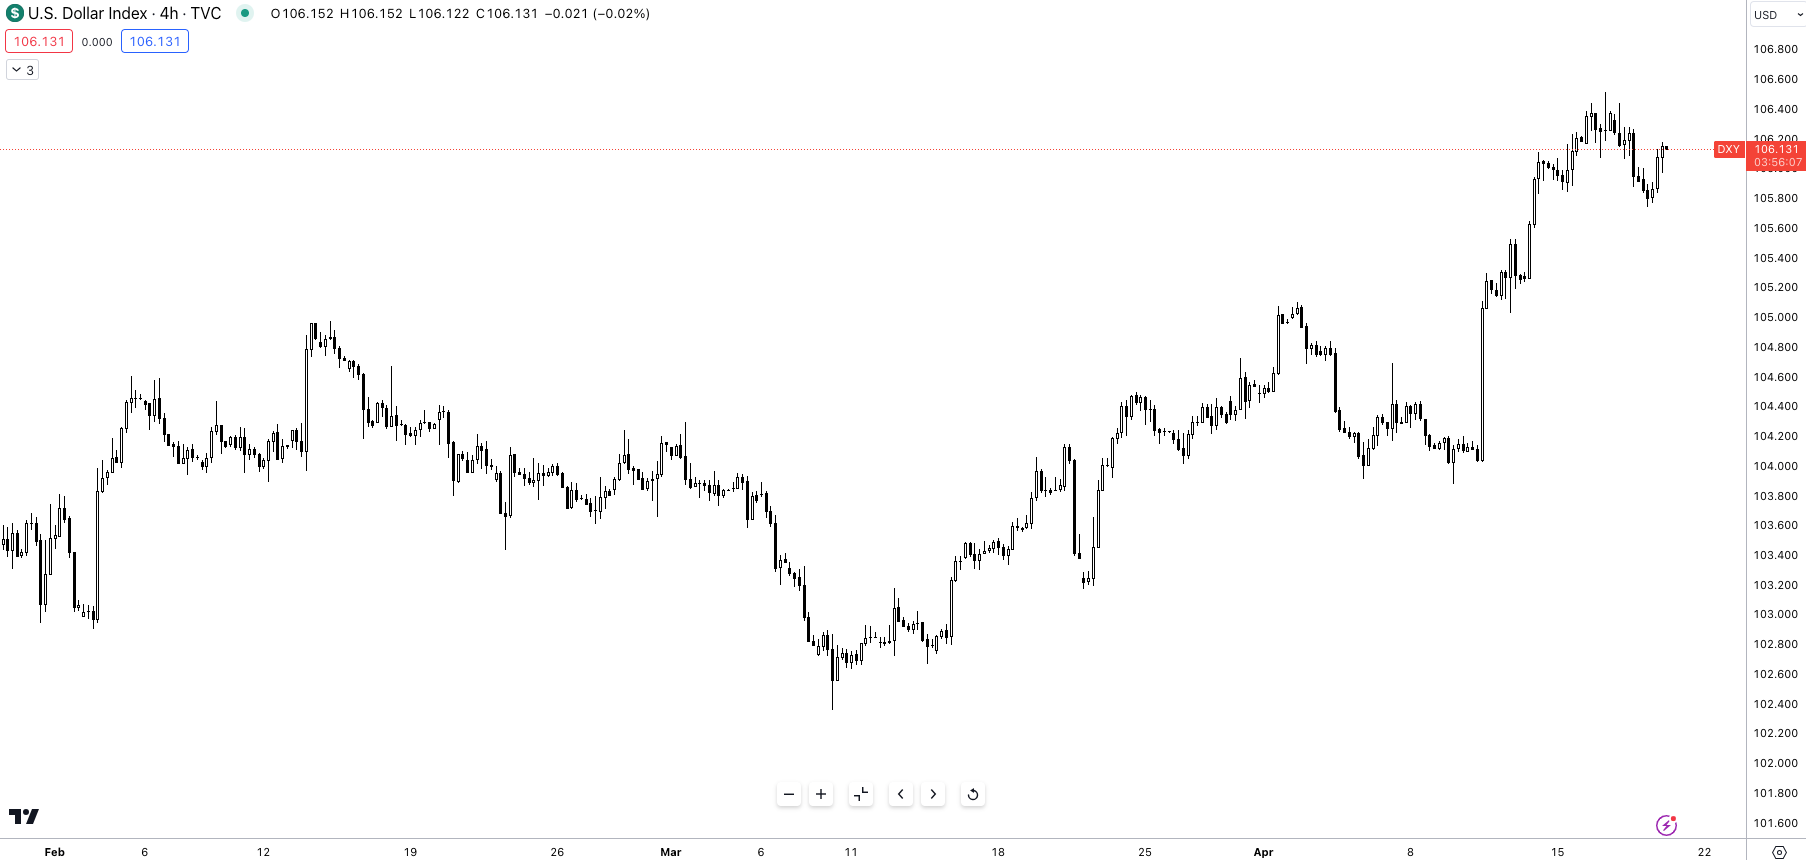
Last week hotter than expected inflation data pushed expectations of a 3/4 rate cuts down to markets now debating over the potential for a single cut. A strong retail sales print, 1.1% vs 0.5% consensus added fuel to the fire helping the dollar maintain its rally of c.5% YTD.
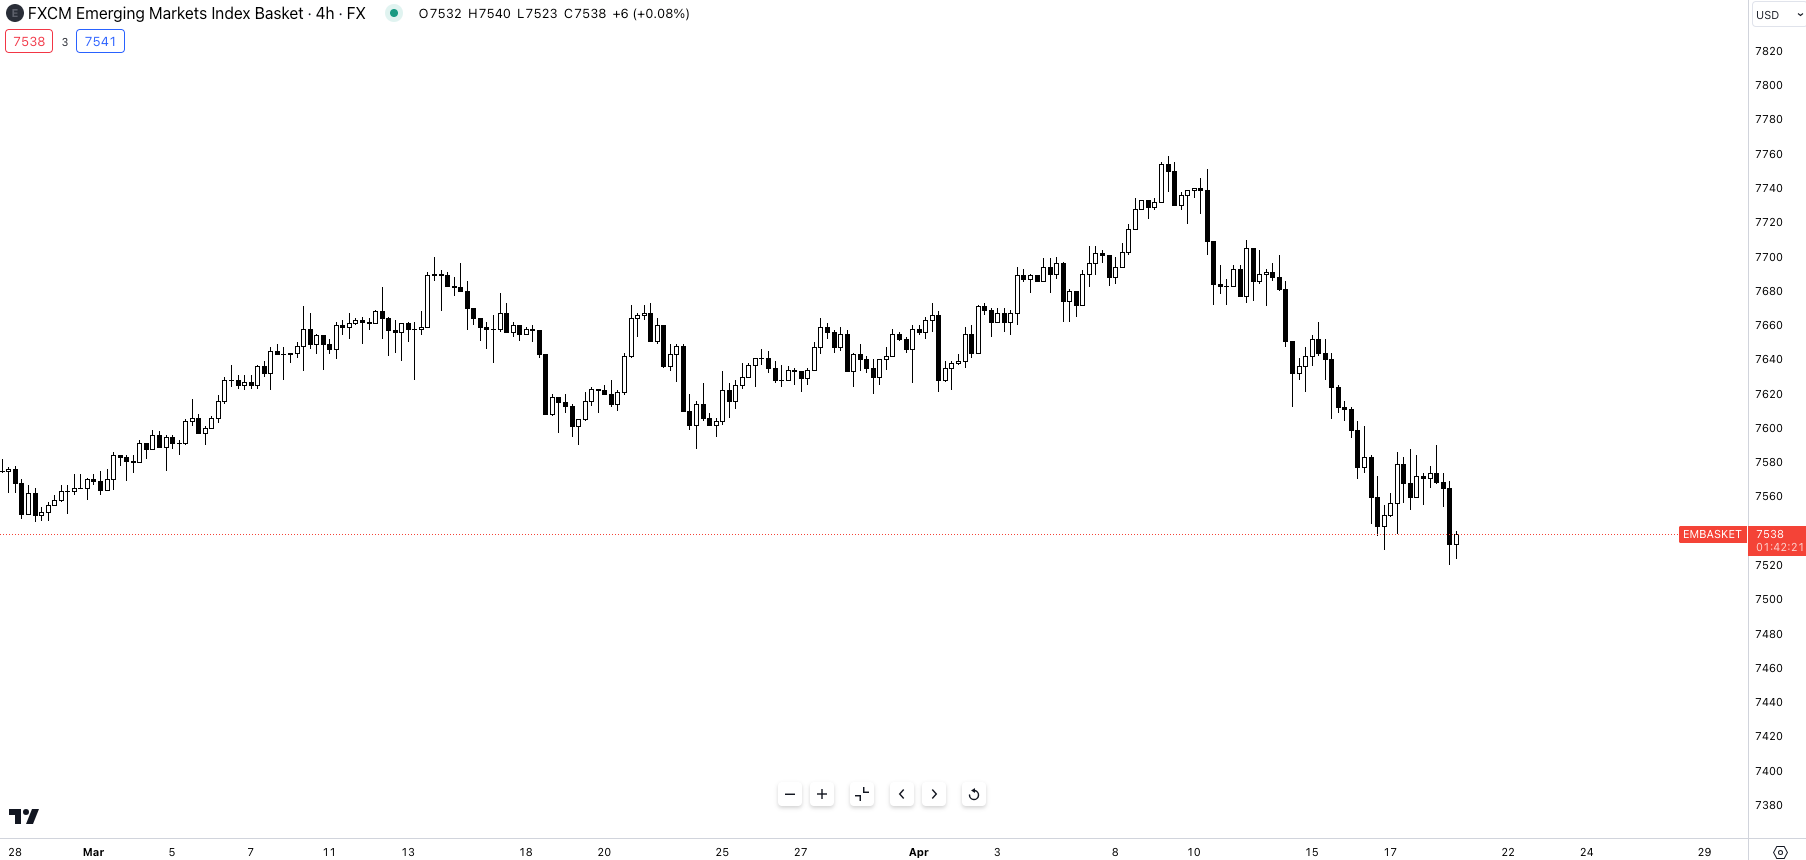
As expected, the basket of EM currencies start to suffer in the light of a stronger and persistent dollar.
Despite the lack of concrete plans for rate cuts, the FX market is already reversing its earlier assumption of aggressive easing. Futures markets now predict a 45% chance of a cut in September, followed by a pause on further reductions until 2025.
Thought of the Week:

An argument many followers of MMT (Modern Monetary Theory) have become well acquainted with. Personally, I would reword this statement like this:
“Here’s why Fed hikes are having less impact on the economy & markets than previous tightening cycles: A 101 on running large fiscal deficits & providing banks with ample liquidity”.
Because in reality, that’s just it— we have to look at all the factors contributing to the strong US growth, equity outperformance and relative resilience of consumers and domestic demand. It’s safe to say the largest single contributing factor to all four metrics would be the fiscal spending embarked on by Biden. The CHIPS & Sciences Act are responsible for more than $300bn in additional investment going towards domestic manufactures, development of supply chains and semiconductors.
Putting fiscal aside one must also acknowledge that whilst the U.S seems ‘resilient to hikes’ due to the majority of private sector borrowing being locked in 2021 for 7-10+ years, the RoW, particularly Europe has struggled due to this exact problem.
Chart of the Week
The return of volatility— *zoom in to read annotations*
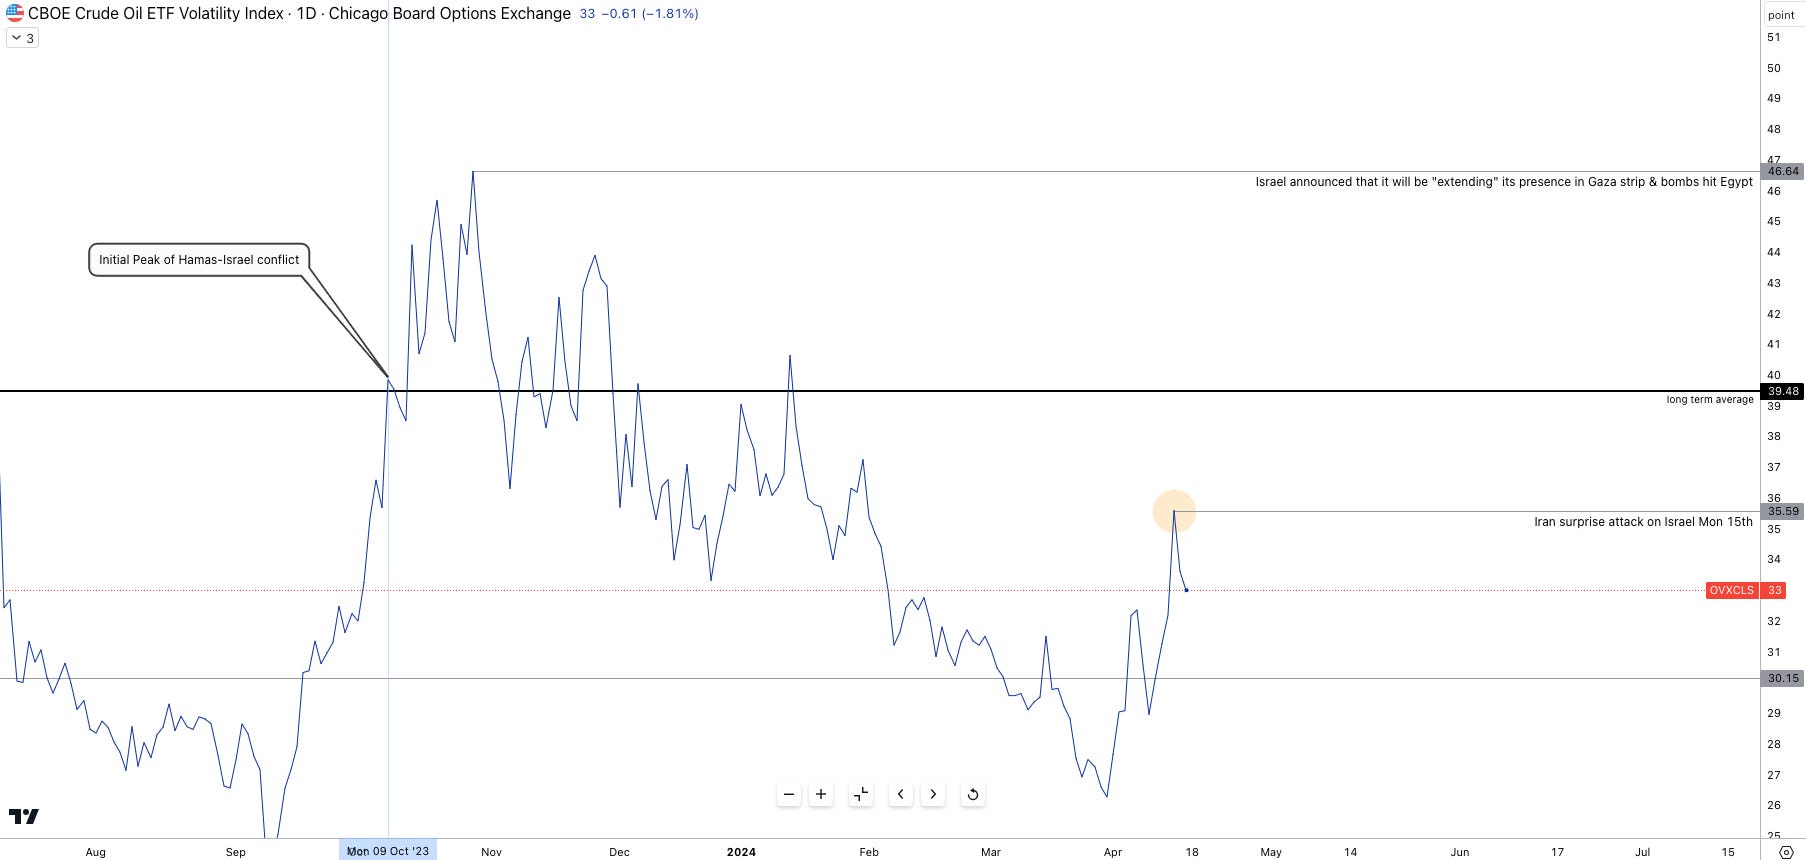
Whilst the tensions and risks of an Israeli retaliation strike to Iran’s strike over the weekend have much settled toward the end of the week, oil volatility peaked sharply on Monday open.
Brent crude is trading at $86.40 with a $4 spread with WTI Crude Oil.
The Yield Curve:
Correlations, Premiums & Convexity
In part one we broke down what a normal yield curve should look like, why the yield curve may be inverted and the different movements one may see across the yield curve.
Here's a crucial factor to consider: front-end rates (those maturing within the next two years) are especially sensitive to monetary policy changes.
The 2-year rate, in particular, acts as a benchmark for market expectations of future Federal Reserve actions. This tight link explains why the 2-year Treasury yield and the US dollar index often move in tandem. Both instruments react to the same underlying force: implied changes in interest rates.
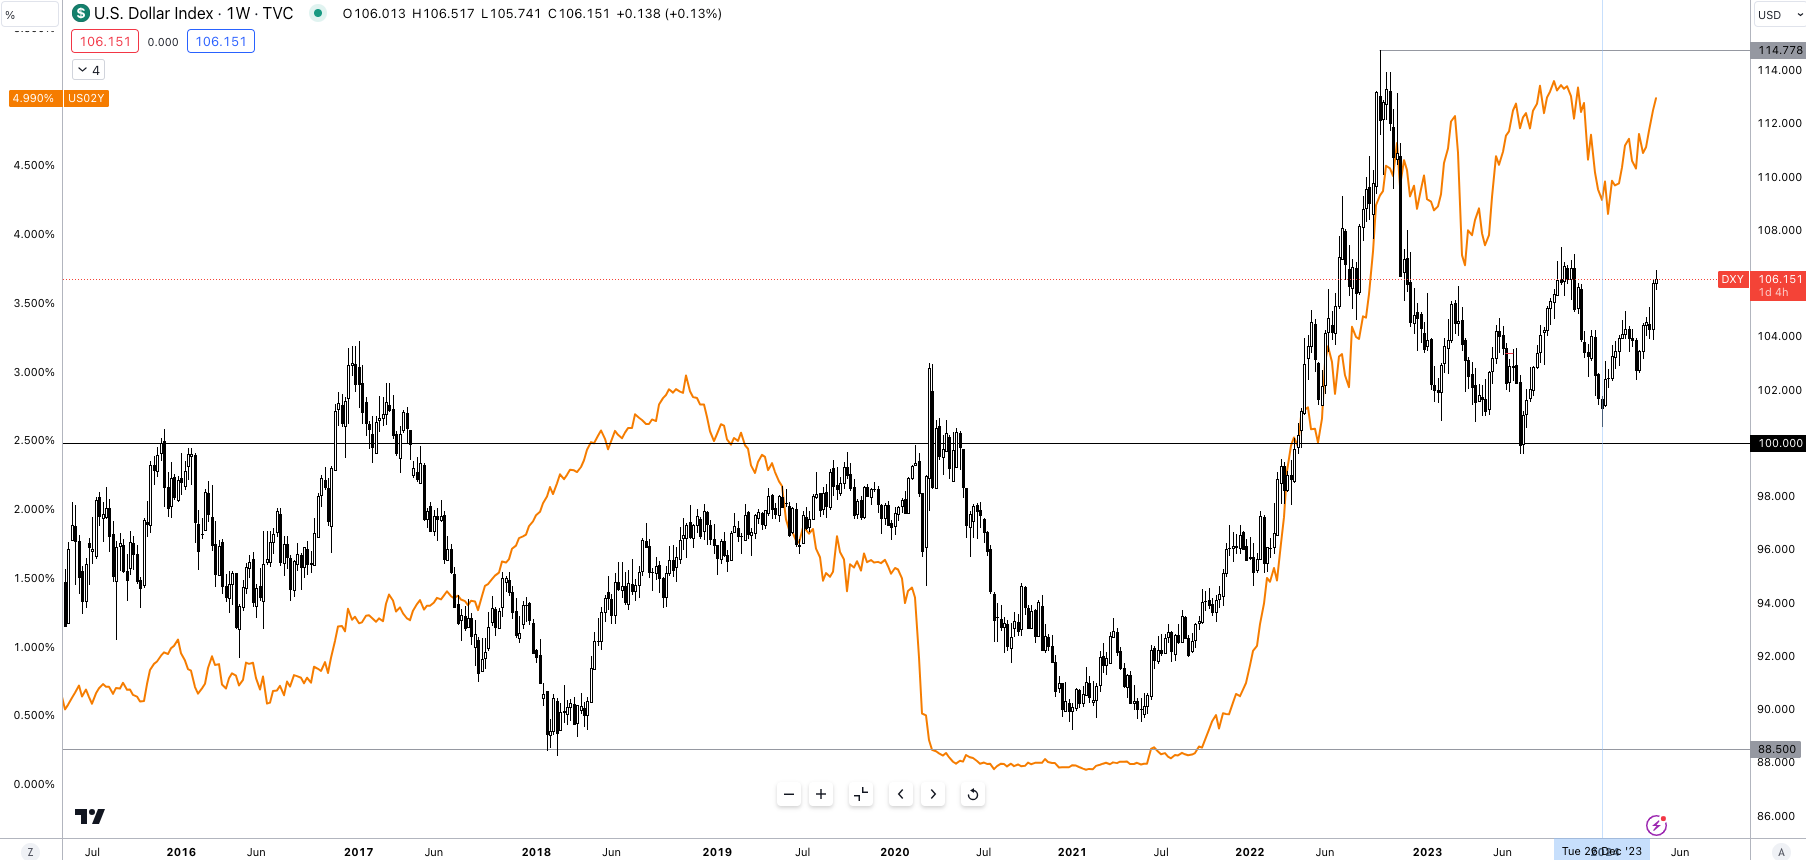
The tight relationship is exhibited in Figure 4; as is always, no correlation is 100% and as such there will be times of dislocation and times of tight correlation where a regression model would point to the correlation having a strong relationship > 0.7.