

The Global Macro Outlook: Q2 Update
The Global Macro Outlook: Q2 Update
10,000ft view of macro, financial conditions & policy outlooks for DM Central Banks

Hey guys,
It’s Q2.
This report is a deep dive, thanks for your patience.
We take a 10,000ft view on global markets, financial conditions and the dominant macro-trends framing our perspective, as such enjoy our review of:
United States economy
The Europe Update
China’s inflection point
Japan’s positioning
US Economy
Stronger Than You Think
Our economic and market update for the U.S. starts by reflecting on previous narratives that persisted much throughout 2023 and how far off from reality the majority of Wall St and independent analysts were.
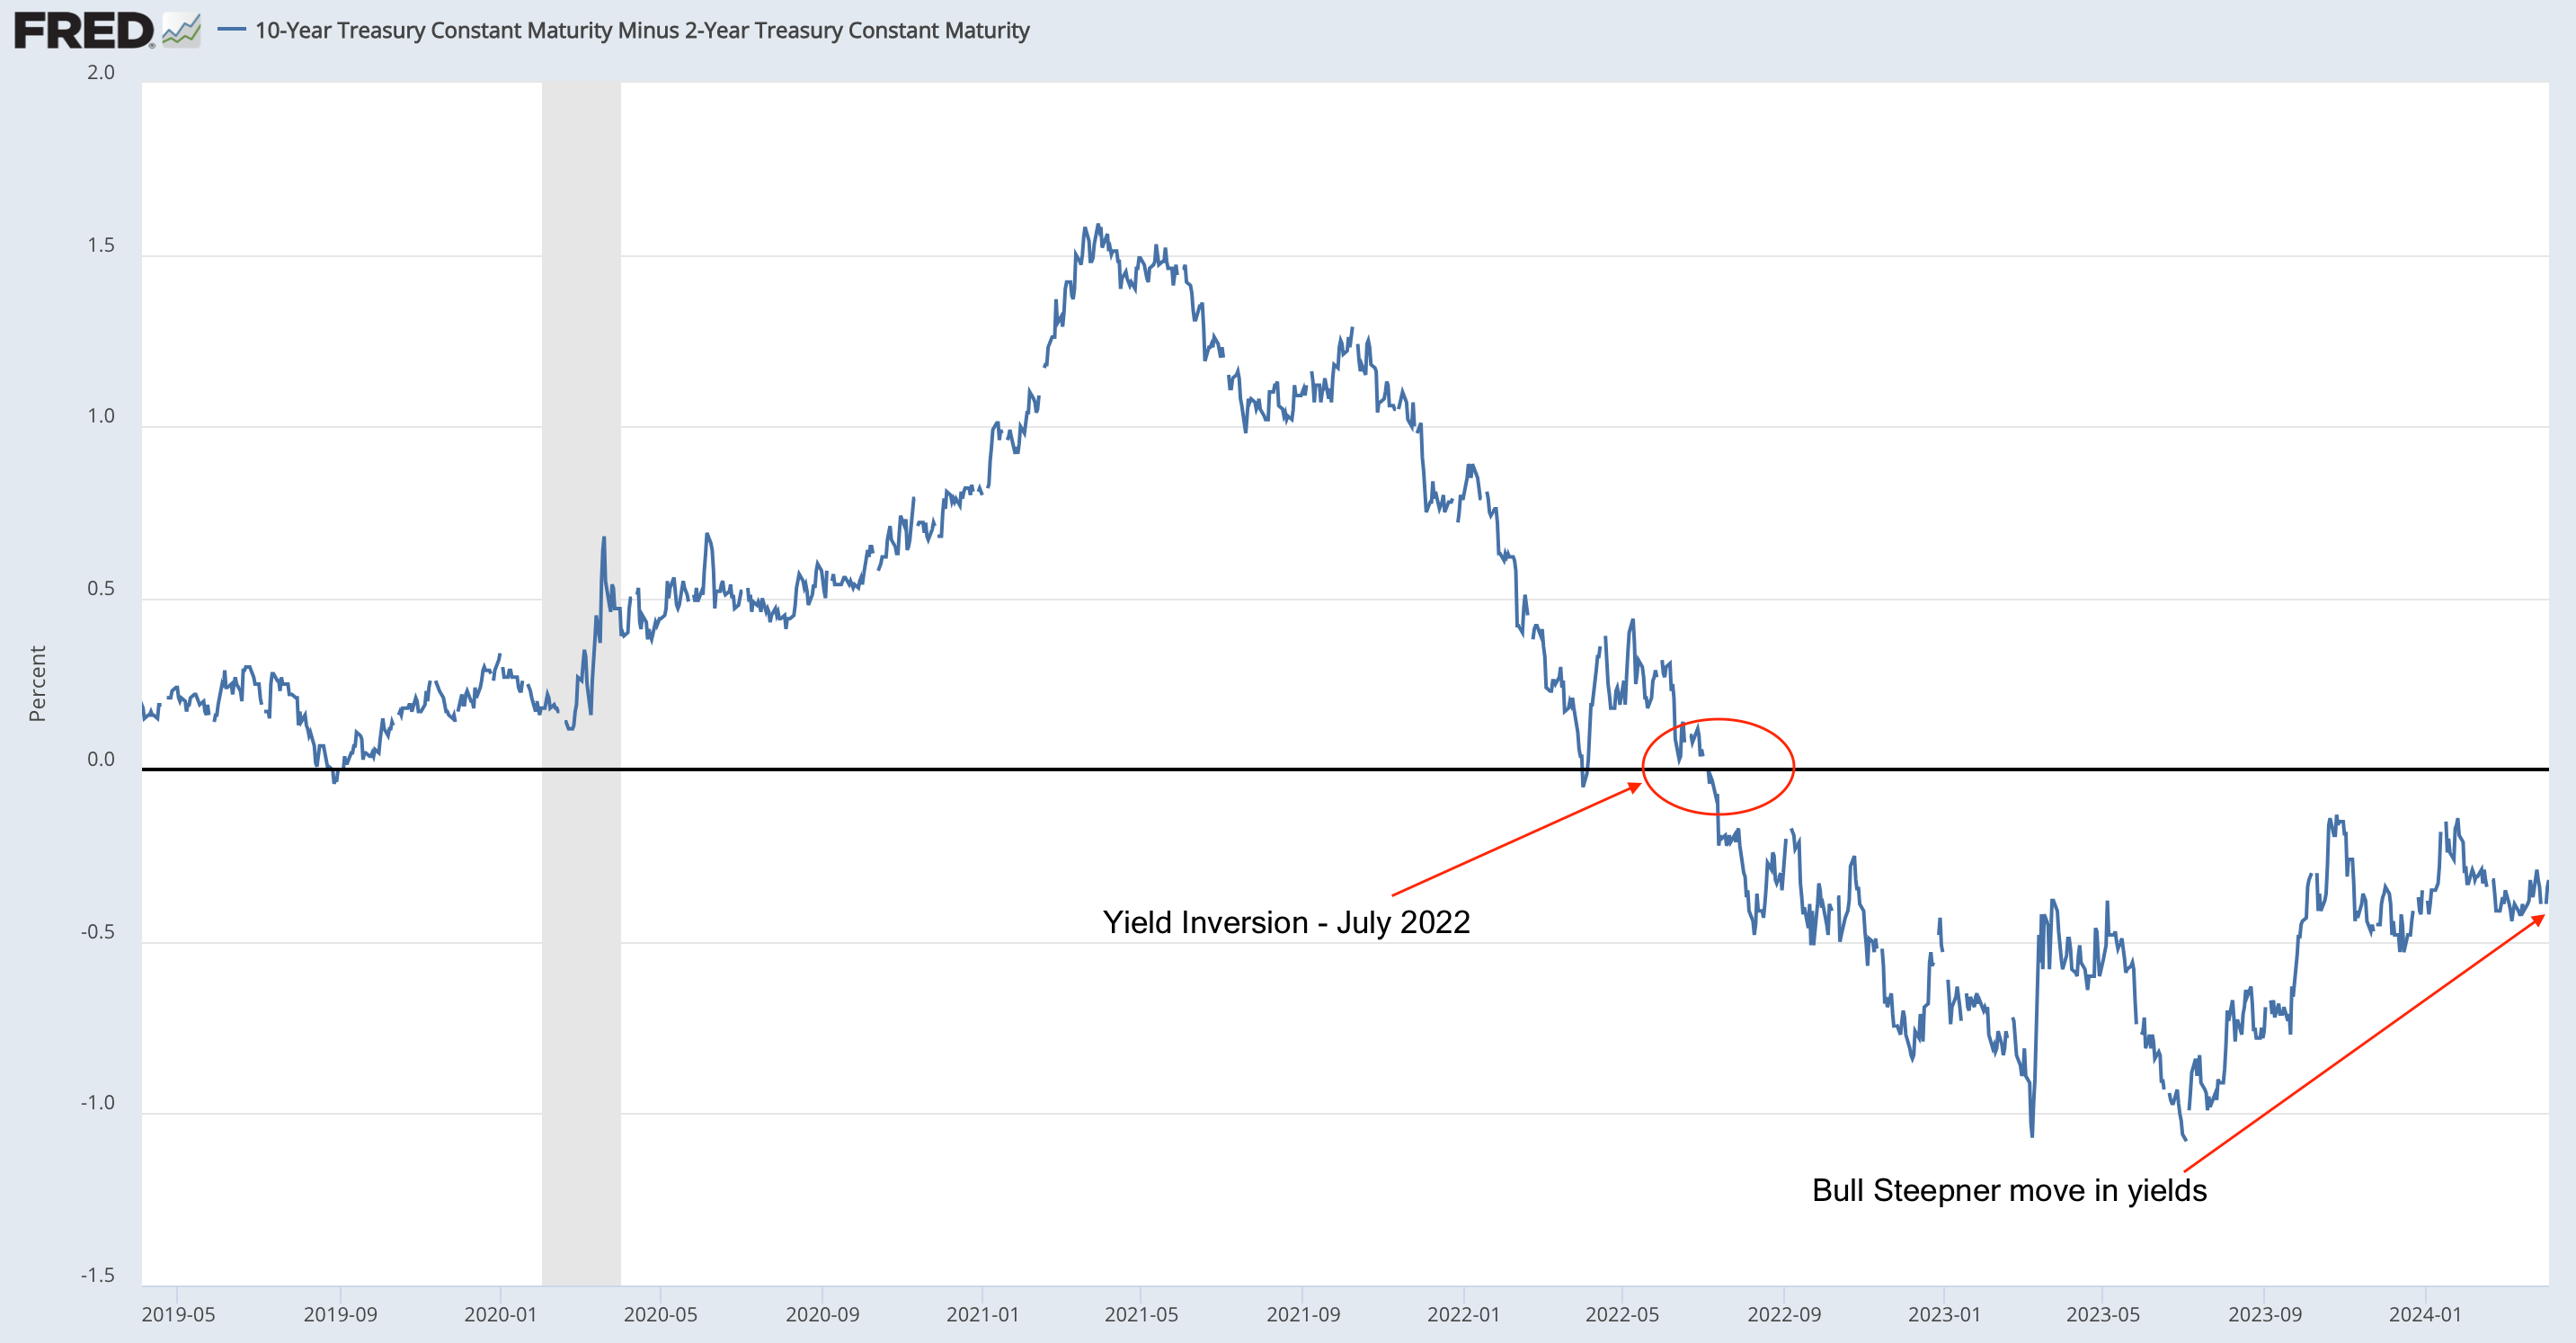
Flash back 21 months. The 2s10s yield curve inversion dominated financial headlines, especially on Fintwit. This inversion, often a recessionary signal, sparked a flurry of analysis – myself included. The burning question: What's the lag time? History suggested a downturn was inevitable, especially with a potential 3m/10y inversion looming. But we were wrong.
The U.S. economy defied expectations, demonstrating remarkable resilience. Inflation peaked and then on a sustained downward trajectory, settling near the Fed's 2% target. Remarkably, the unemployment rate remained below 4%. Larry Summers, the former U.S. Treasury Secretary and economic heavyweight, had a different take in the summer of '22. He argued that taming inflation required…
“two years of 7.5 percent unemployment or five years of 6 percent unemployment or one year of 10 percent unemployment”
— Larry Summers, Economist & former U.S Treasury Secretary
The narrative shifted dramatically. Inflation steadily eased, the unemployment market received a boost from a positive immigration flow. Wage inflation cooled, and a resurgence in U.S. supply chains added another layer of positive momentum.
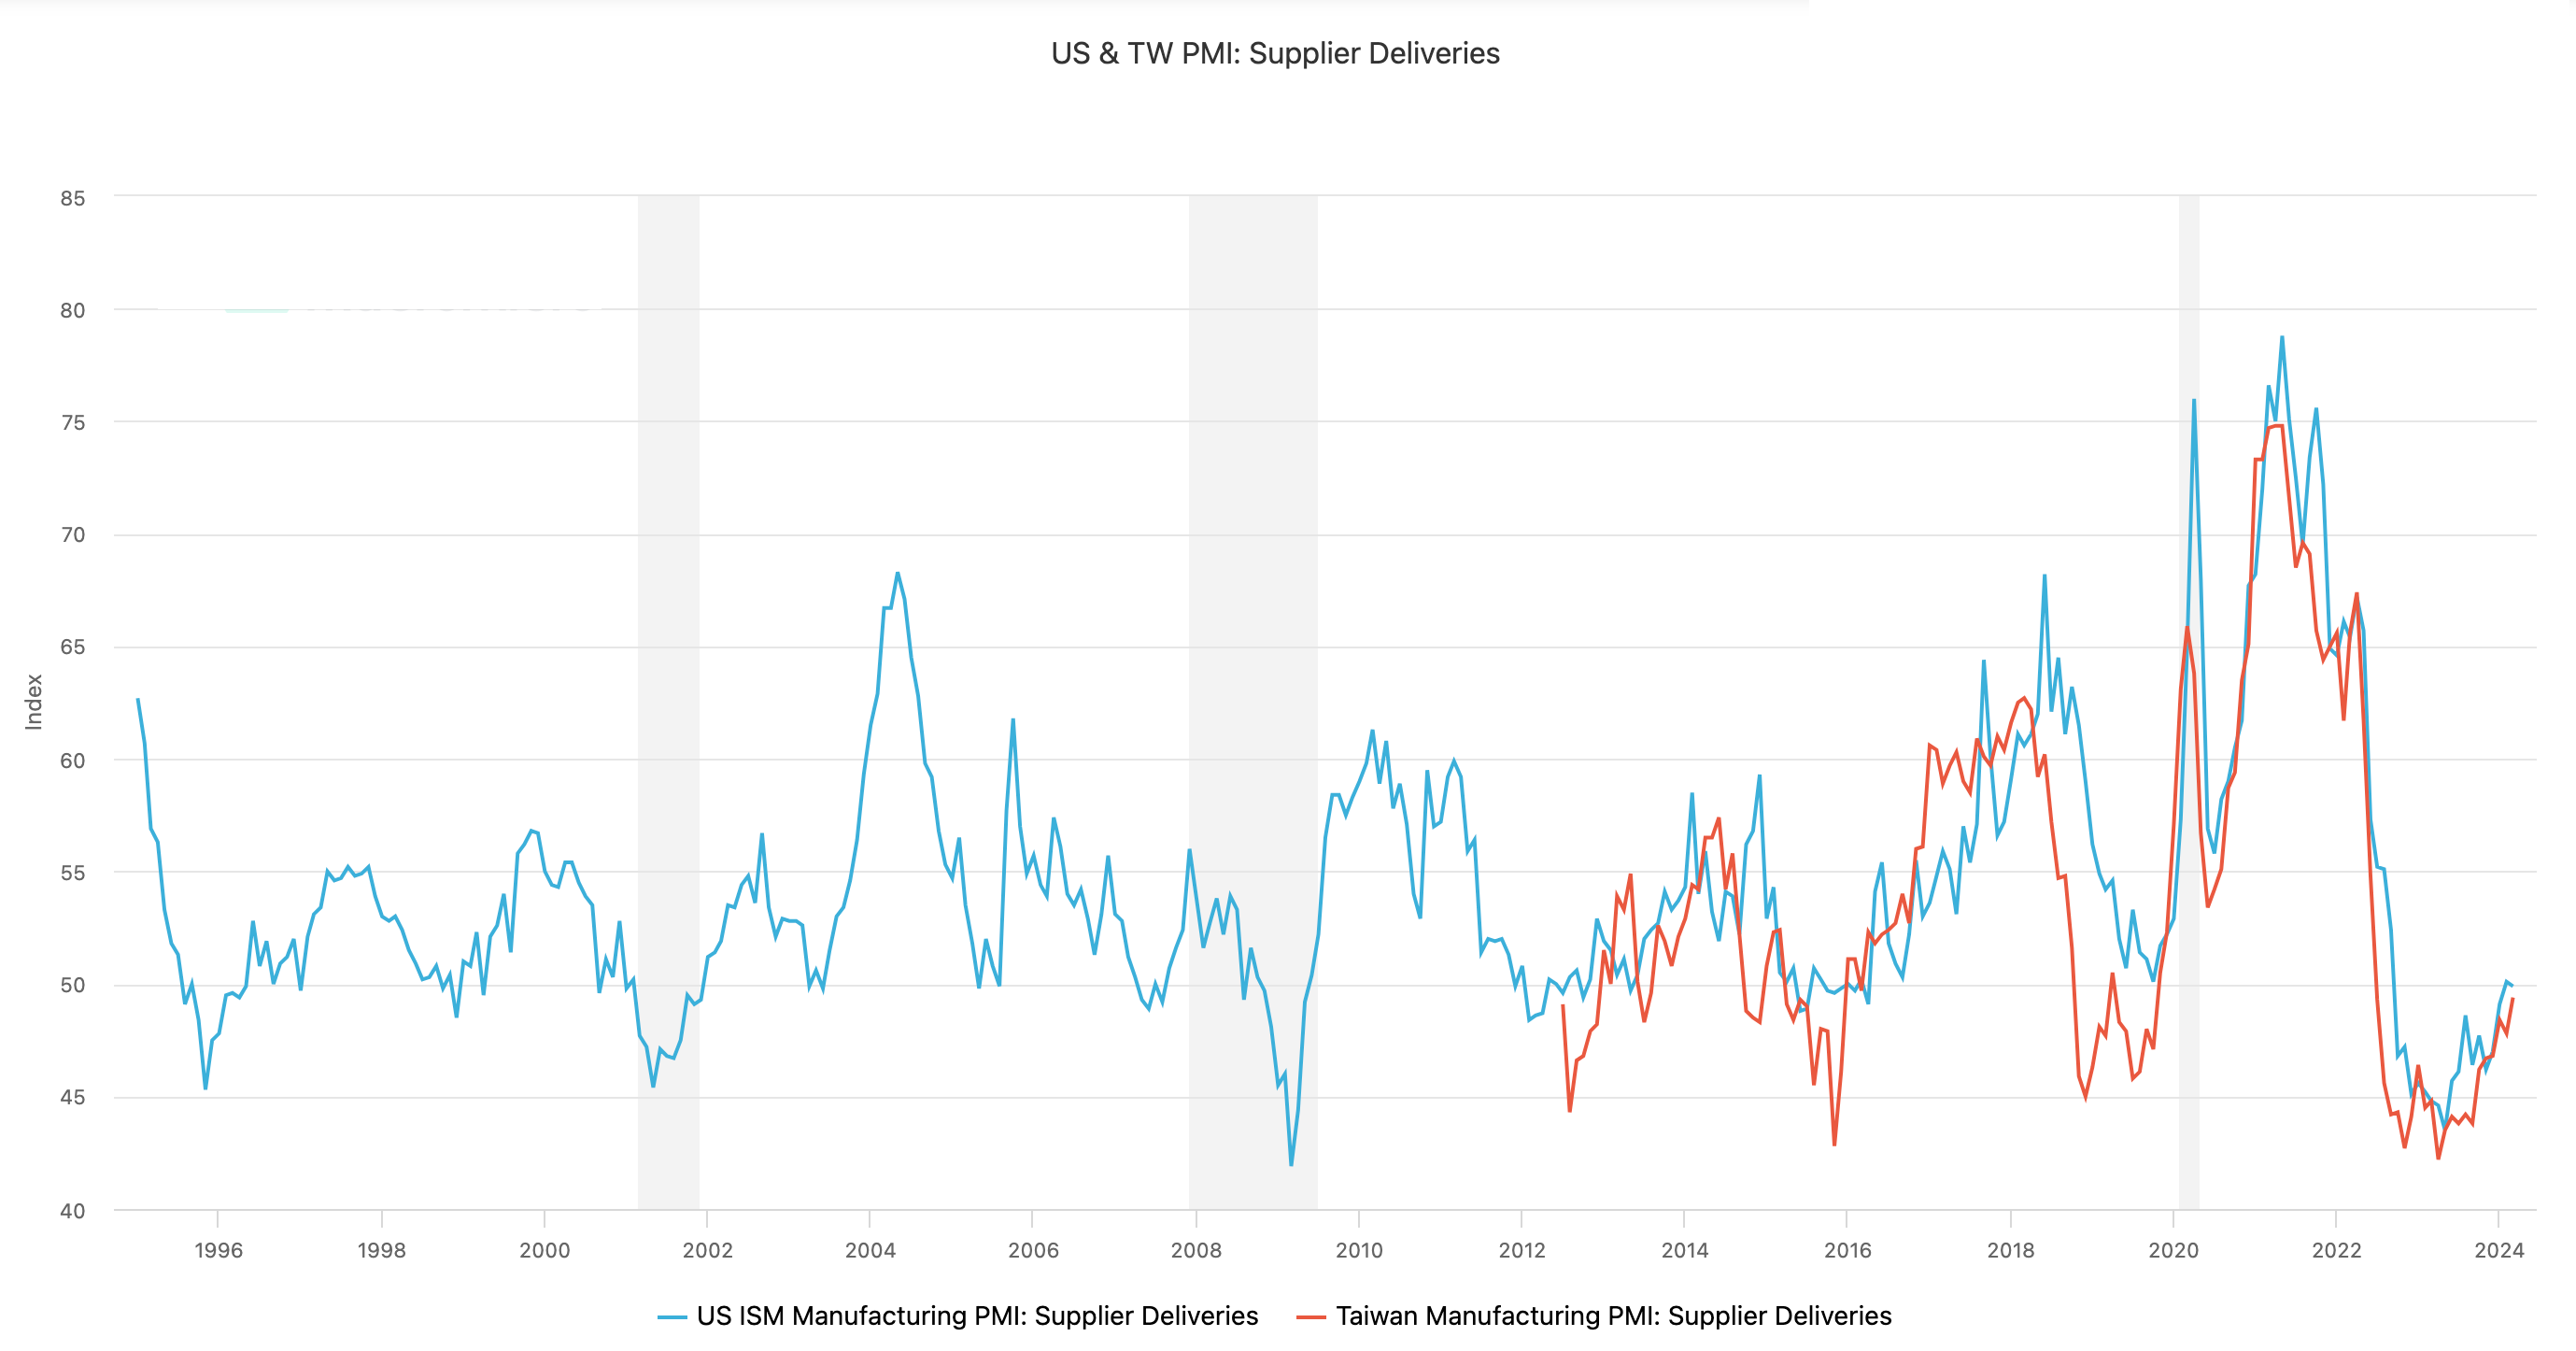
Figure 2 is a measurement used in PMIs to gauge the speed of deliveries from suppliers to customers, reflecting the prevailing trend in how long it takes for businesses to revive their orders from vendors. The Suppliers' Delivery Times Index (SDTI) serves as a key indicator of supply chain health. A reading above 50 suggests faster delivery times for a greater proportion of businesses, signifying reduced backlogs and delays. Conversely, a value below 50 suggests that more businesses are experiencing delays and slower delivery times which clogs up the supply chain from the producer level to the end user.
Since April 2023, both the US ISM manufacturing PMI and Taiwan manufacturing PMI have been on a recovery which has eased inflationary pressures within the U.S. Taiwan’s importance to global trade is significant, as the world’s leading semiconductor manufacturer, Tawainese manufacturers have built a deeply integrated tie into global supply chains, assisting the development of a range of electronic products assembled worldwide. So, slower supplier deliveries from Taiwan have ripple effects across the globe.
Economic Strength Casts Delays for Fed Cut
Real GDP growth increased 3.4% in Q4 of 2023, an upward revision from the 3.2% preliminary figure.
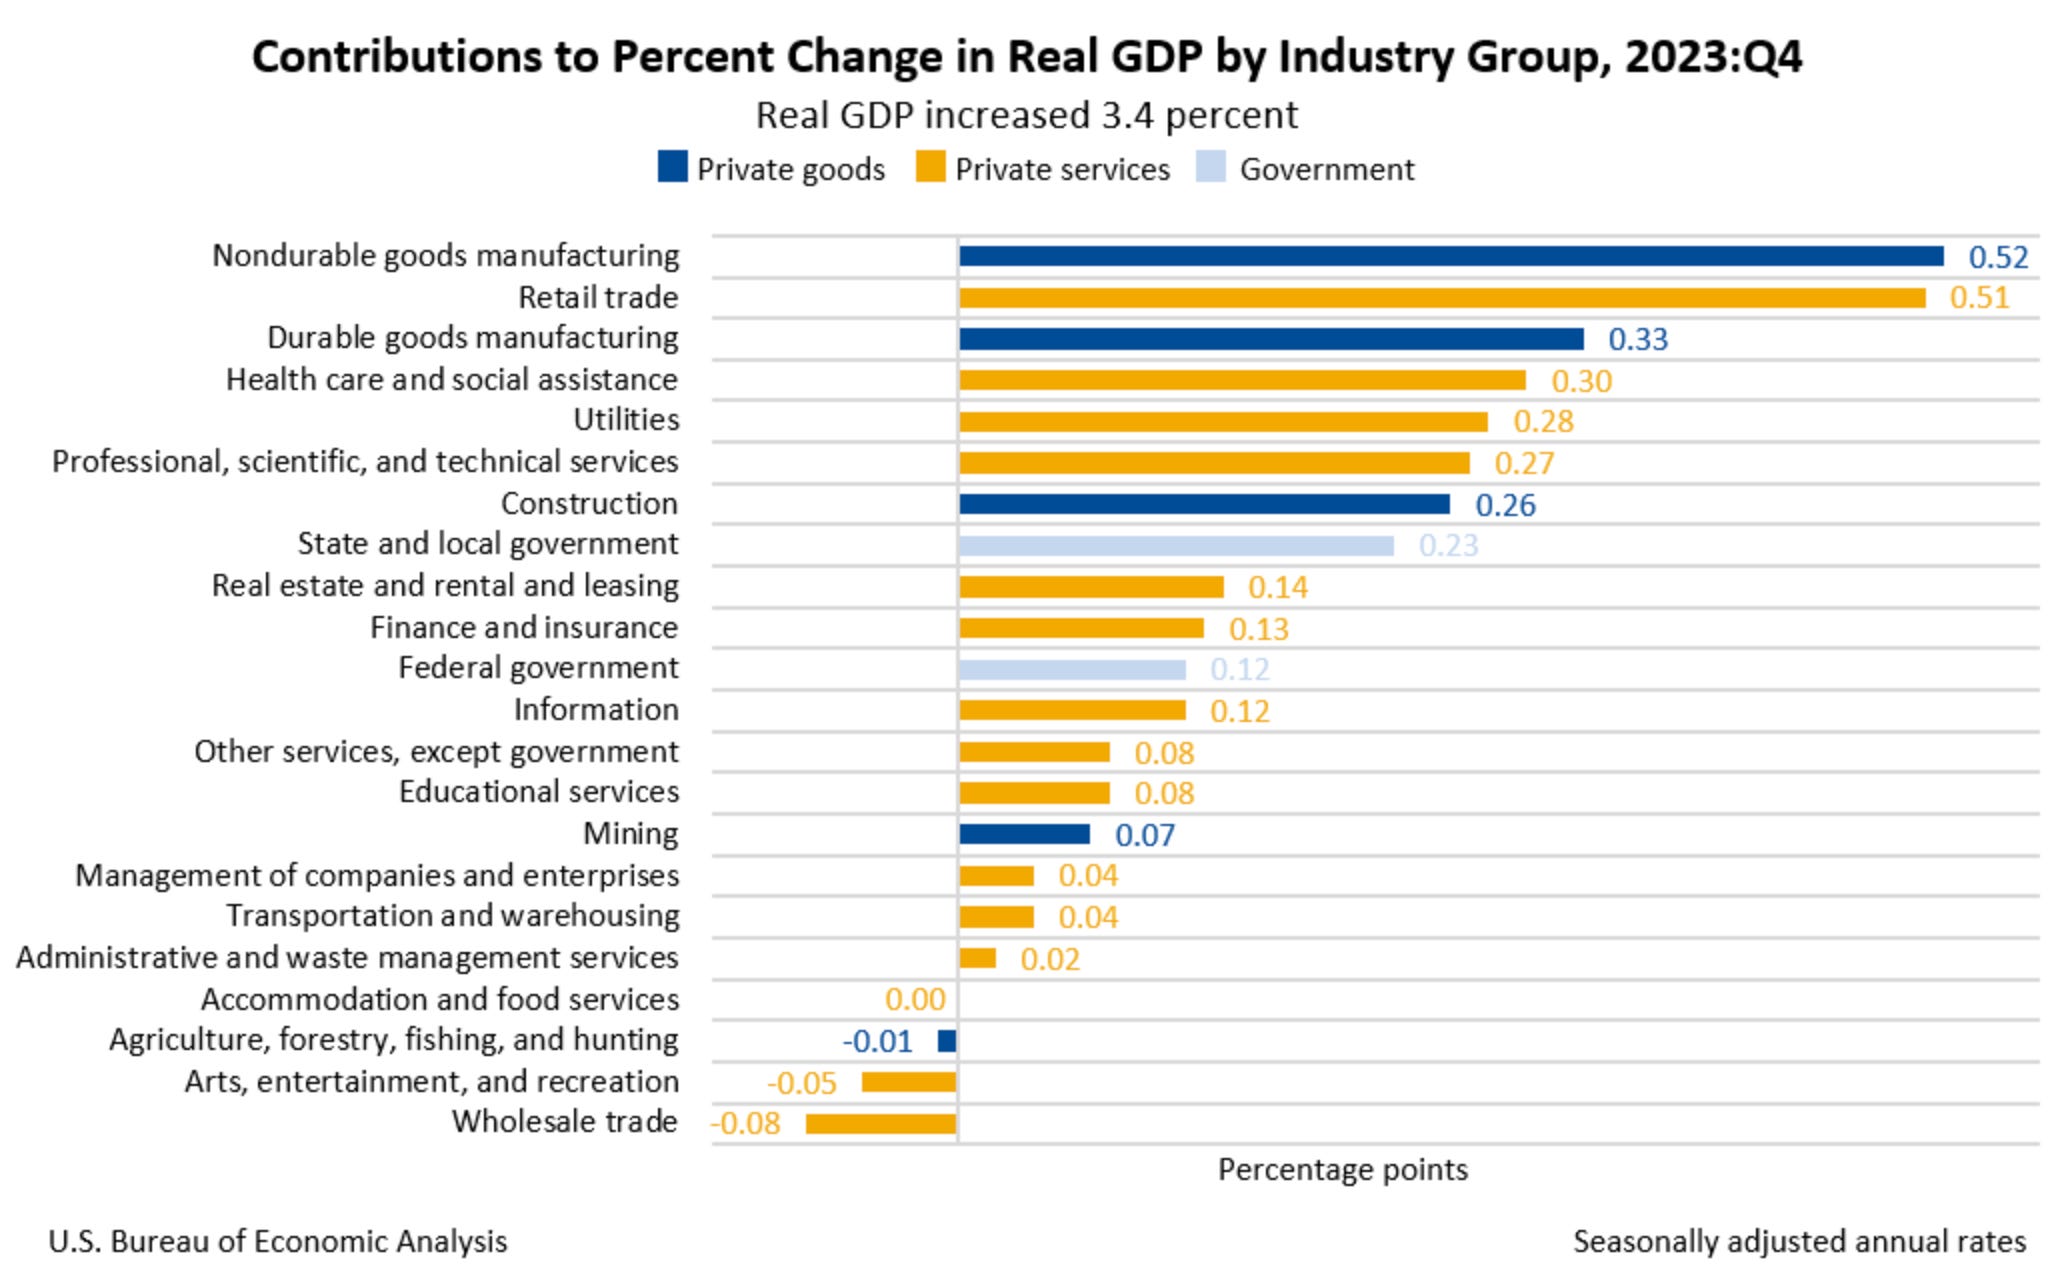
One key factor for economic growth that we underestimated, was the significance of fiscal stimulus. The Biden administration embarked on the largest expansion of the fiscal deficit (outside of a recession) in over five decades. This largess has trickled into the real economy stirring up real demand amongst businesses and consumers. When monetary and fiscal policy fail to act in unison you get economic disconnection and disfunction, much of what we’re seeing today.
Economic theory tells us that as inflation rises, interest rates must rise subsequently to curb unsustainable inflation in the economy. As rates increase we expect to see looseness in labor markets, demand for durable goods and liquidity in financial markets dry out. However, what we’ve seen in reality is much of the opposite, demand for durable goods has increased, the labour market has tightened with JOLTS showing a level of excess demand for labor and financial markets have been in a bull market. All whilst rates sit at 5.25%.
Forward Outlook & Potential CRE Headwinds
The Federal Reserve's monetary policy path remains intricate. They must carefully navigate ongoing economic data to mitigate potential inflationary pressures without hindering economic growth by keeping interest rates restrictive for an extended period.
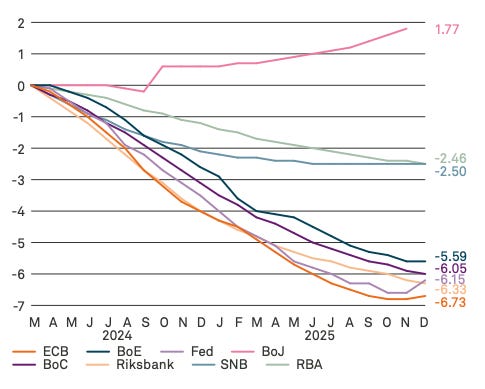
As Figure 4 shows, the market is expecting anywhere between 6/7 cuts for the Fed and its DM counterparts leading into 2026. Much like the second half of 2023, we expect continued US economic dominance with the Fed cuts reducing potential headwinds of economic fragmentation in specific rate-sensitive parts of the economy, namely commercial real estate. Even commercial real estate, as the largest headwind for the US, has a rather limited level of risk for the States, for smaller banks CRE debt makes up c.28% of their assets whilst amongst SIB (systematically important banks, banks with >$250bn) CRE loans only account for 6.5% of assets.
Now, as long as deposit flow remains consistent and controlled this brewing CRE storm will be sustained by these non-SIBs.
Europe Outlook
There’s Hope For Europe
Resilience is one word we could use when discussing Europe, even though they sit in a ‘mild’ recession, the European economy against all odds, has escaped severe economic headwinds ranging from insecurity in energy prices from the Russia-Ukraine war, to struggling manufacturing sector data and weak demand for factory goods.