


How To Trade Global Macro: A Practical (Easy) Guide
Global Macro Trading Explained: Strategies and Insights

Hey guys,
A bit of a different write here from me, but you guys absolutely loved the interest rate differentials trading primer.
This week I’ll be diving into how you can utilise your macro knowledge on charts, which is one thing that many get stuck at.
I’ll be making it as simple as possible, cutting the nonsense.
Take notes, let’s get into it!
Trading Global Macro
Just a heads up, there will be some things mentioned that you may struggle to find. Don’t worry because I have you covered, there will be sources of information at the bottom of the report!
Step 1: Knowing the data
This is usually the stage where people get way too caught up, we need to cut the noise. Honestly speaking, unless your trade is predominantly driven by small data readings like housing starts, industrial production or shop price indexes, don’t stress it.
In my opinion, there are two things that build a trade, data and dynamics. On the data side, you can build your trade around hard data like inflation expectations because that gives an insight into what the central bank will do (as a basic example). On the other hand, you can build a trade from current global dynamics (which is a little tougher), like Trump’s tariffs. As an example, you may build your trade around Trump de-escalating the trade war. So you have your two trade types: Data and dynamics. The highest quality trades have both the hard data and the current global dynamics in favour of your bias.
As I said at the beginning, I want to make this as digestible as possible, so let’s look at what we need to focus on when it comes to the data side of our trades:
GDP - Shows how fast the economy is growing, which drives overall risk sentiment.
CPI/Core CPI - Tells you if prices are rising too fast, pushing central banks to tighten or ease policy.
PPI - Shows inflation at the wholesale level, which can signal future CPI trends.
Labor market/unemployment - Signals how strong or weak the economy and consumer spending is.
Interest rates and OIS pricing (interest rate expectations) - Interest rates and interest rate expectations drive markets ahead of actual hikes or cuts, which controls the pricing of currencies and yields.
Once your data is set, you have an easier task in identifying what type of regime we’re in and can start making your basket of assets smaller for picking the best trade. Let’s get into regimes.
P.S. - This is the easy part.
Step 2: Identifying the regime
When looking for your position, you need to begin the process as zoomed out as possible. Being as zoomed out as possible leads to the question, what regime are we in?
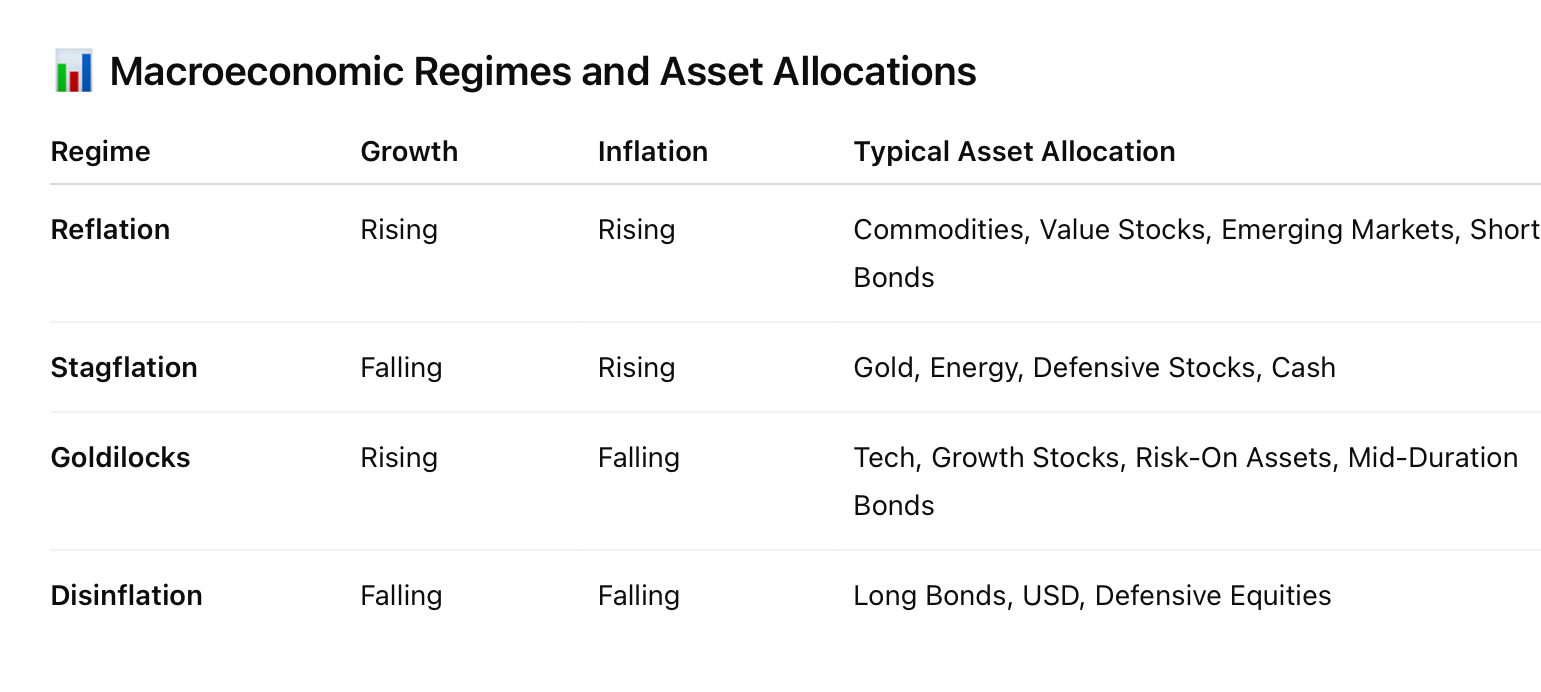
As simple as possible, a regime is a market environment or condition. Let me break down the 4 regimes below:
Regime 1 - Reflation (rising growth & inflation)
Regime 1 typical portfolio allocation - Commodities, value stocks, EM, short bonds
Regime 2 - Stagflation (inflation rising and growth falling)
Regime 2 typical portfolio allocation - Gold, energy, defensive stocks, cash
Regime 3 - Goldilocks (growth rising and inflation falling)
Regime 3 typical portfolio allocation - Tech, growth stocks, risk-on, mid-duration (neutral) bonds
Regime 4 - Disinflation (growth and inflation falling)
Regime 4 typical portfolio allocation - Long bonds, USD, defensive equities
Key note for you guys, the “typical portfolio allocation” is a generalised rule of thumb. This doesn’t mean that these are the greatest allocations every time we enter that regime. There will be anomalies like the current market environment we’re in, where these typical allocations aren’t seen.
For anyone wanting to have this on a cheat sheet style template:
Step 3: Tracking markets:
This is where we begin to see how global markets are aligned with our idea. Now we don’t need to scan every market of course, but there are some key trends we want to look for.
Government Bond Yield Spreads - How are the government bond yields between countries trending? For example, is the spread between the US 10Y and 10Y German Bunds widening (people are moving money from US to Germany or visa versa). This gives an idea of where investors are fleeing too, especially in times of economic damage, like the current environment. In the chart below, the chart decline represents investors moving money into US Treasuries more than German Bunds (lowering the US bond yield), when it moves up it means the opposite and money is flowing into German Bunds (lowering the German Bund yield).

Credit spreads - As simple as possible, a credit spread is the difference in yield between a corporate bond and a government bond of the same maturity. The spreads between corporate and government bonds are key to track because it’s a large tracker of risk appetite and sentiment. These spreads can give an early recession sign, track liquidity and help navigate financial conditions. For ease of understanding:
A wide credit spread = Investors are nervous. They think lending to companies is risky, possibly because a recession or defaults may be coming.
Tight credit spread = Investors are confident. They think companies are safe to lend to, and the economy is stable or growing.
If you haven’t got access to a source like Bloomberg, you can track credit spreads via the high-yield spread proxy: Ticker = HYG (iShares iBoxx $ High Yield Corporate Bond ETF)

Oil prices - The price of US oil can give an insight into what investors are expecting global growth to look like, although the price of oil is also driven by things like OPEC+ production changes which is why we don’t use it as a key indicator. Oil also gives an idea of how future inflation may look. As seen in 2022, sky-high oil prices led to sky-high inflation. So this can be used as a rough tracker of global growth and inflation expectations.
Interest rate differentials - IRDs are typically only used as a high important indicator if your trade is FX based, because IRDs drive FX markets. However, it’s not to say that it’s useless when it comes to other assets because the difference in rates also determines global capital flows and can affect equities/bonds.
Remember, we’re not basing our trade solely off of just one of these market correlations, neither are we waiting for them all to align. What we’re looking for is a consistent theme in line with our bias, but that is where experience will pay and you will understand how many of these you need in alignment to create a high probable trade, because having them all is just not realistic frequently.
I hope you’re still with me here, this is being explained in Layman’s terms.
Step 4: Major global dynamics + whats is priced in?
Now is when you step it up a little. When monitoring global dynamics, it’s crucial to cancel out the noise and focus on the real data we have. I’ll put an example of noise vs real data below:
Noise headline - “China says that if the US wants a resolution, they need to stop making threat’s”
Real data headline - “Trump imposes a 90-day pause on all reciprocal tariffs”
Remember what I said above, trades can be most fruitful when dynamics align with data. If the data is showing dollar weakness (hard data) while Trump is making American’s fearful (dynamics) then you have the best recipe, data and dynamics, for a trade.
When it comes to global dynamics and headlines, it’s also key to note that not every headline is a trade. That is where you make the difference between noise and real data as explained above, a trade is made with real data.
Now, we step it up yet again. What is priced into the market?
When it comes to interest rates, it’s pretty simple to see what is priced in because you can just take a look at the overnight index swaps (OIS) and they will tell you how many basis points of hikes/cuts are priced in. However, when it comes to global dynamics it can be a little tougher to tell whether your idea is priced in and how much if so. Let me try to break this down in simple terms below with some key questions to ask yourself:
Why has the market trended up/down recently, what was it that drove those moves? - That can be data or dynamics, but you need to put your finger on what has driven the market right now. If your current idea has driven the market, you may be late to the party but it doesn’t mean your position is over.
Based on what has driven the market, do you believe that it is overpriced or under priced? Example - If a recession has driven your equity lower, but you believe that a recession is a low probable scenario, you now have some discounted pricing. This means the market has overpriced a scenario because if you’re correct then the market now needs to price out a recession (bullish).
In a scenario where your idea has currently been driving the market, you need to determine if you are late to the party. So, from where your idea began driving the market, how far has the market moved? Has your idea been fully priced in (created a substantial move)?
So, now you can determine what is priced into the market, whether your idea is overpriced or underpriced, and also whether you’re late to the trade.
This is a basic, but great, example of how a market can provide high quality opportunities if pricing for your idea is discounted.

Step 5: Choosing your asset:
You now know the data, the regime, the market is correlated and you have a solid idea of what is priced in. It’s now time to choose your asset of choice.
Based on the reasoning for your trade (e.g. slowdown in global growth, high inflation, risk-on mood), what is the most sensitive market for that (equities, indices, FX, bonds).
Ok, you’ve chosen the asset you want to express your idea on. Now, what is the best way to execute the trade? Is it ready, does it need a little more time or do you want to see the market begin to be driven by your idea? This is how you determine whether to use options, futures, buy/sell stops, buy/sell limits or market execution
Oh, you thought we were done there?
No, the more the merrier.
Are there any catalysts that may bring your idea to life in the market? For example, if your idea is around global growth - Is there a hard data reading (GDP), company earnings or Fed speech coming up?
Remember, we don’t need every single confirmation but the more there are, the higher probable the scenario becomes.
Correlation - Is your trade consistent with equities, yields, other currencies. What I mean by this is, is there a net weakness/strength in the market you’ve chosen as a whole or is it specific to that one ticker? For example in equities, is that specific stock strong (earnings etc) or are stocks in general strong. For FX, is that specific currency strong/weak or is it just that pair that is strong/weak.
A very small, but final question - How does the asset you’ve picked perform around this time of year (seasonality)?
Your checklist is complete, I can now show you another example of this put together below in an equity idea.
Equity example:
Make sure to study Figure 4, that is an example of a trade on an index.
Equity idea (this was given in Q2 outlook):
Sources:
Charts and headlines - Twitter (X):
Walter Bloomberg (DeItaone)- Real time Bloomberg headlines
Holger Zschaepitz (Schuldensuehner) - Bloomberg charts
Menthor Q - (MenthorQpro) - Bloomberg/useful charts
Daily macro briefs:
XTB morning wrap
ING FX daily
MUFG daily snapshot
Hard data and economics calendar:
Investing.com
Trading Economics
That’s a wrap, let me know if this was useful in the comments!
you forgot to add Market Macro Hub by Alfie kerswell as one of the sources of information 😉
Very well organized, beautiful!